Order Book
Nydar's order book widget shows real-time buy and sell orders with depth visualisation and cumulative volume
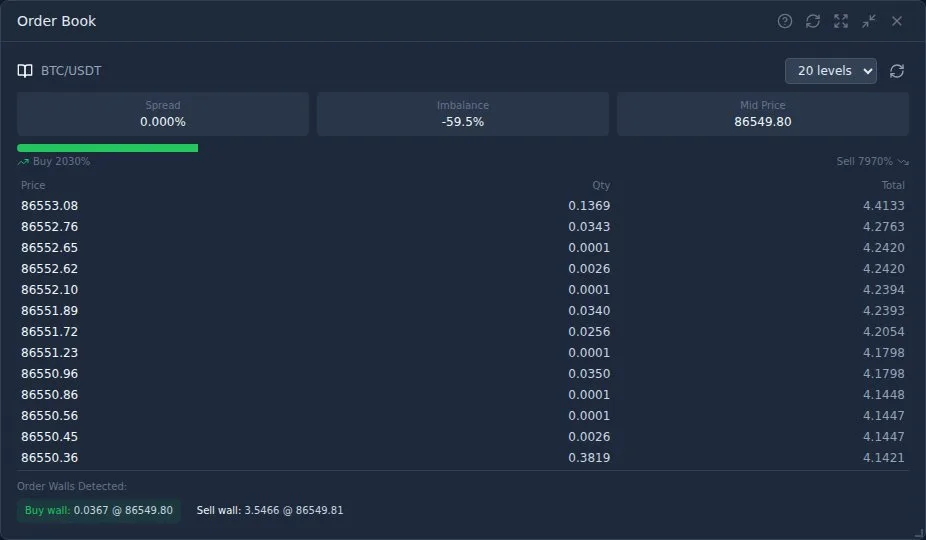
What Is Nydar's Order Book Widget?
Nydar's Order Book widget streams live bid and ask data via WebSocket and displays depth bars, cumulative volume, and a bid/ask imbalance ratio for the selected trading pair. It shows you exactly how much liquidity sits at each price level and where potential support/resistance forms based on order clustering.
Understanding Nydar's order book display helps you gauge market sentiment, find optimal entry/exit prices, and anticipate short-term price movements. Nydar calculates a bid/ask imbalance ratio automatically so you can quantify buying versus selling pressure at a glance.
The theoretical foundation for order book analysis was established by Glosten and Milgrom (1985), in "Bid, Ask and Transaction Prices in a Specialist Market with Heterogeneously Informed Traders" (Journal of Financial Economics, 14(1), pp. 71-100), who demonstrated that the bid-ask spread exists because market makers must protect themselves against informed traders -- wider spreads signal higher adverse selection risk, a dynamic Nydar's spread display captures in real time. Kyle (1985), in "Continuous Auctions and Insider Trading" (Econometrica, 53(6), pp. 1315-1335), showed that informed traders strategically split large orders to minimise market impact, which is why Nydar highlights iceberg detection and absorption patterns. Huang and Stoll (1997), in "The Components of the Bid-Ask Spread" (Review of Financial Studies, 10(4), pp. 995-1034), decomposed the spread into order-processing, inventory, and information components -- finding that the information component accounts for 35-50% of the spread in actively traded securities, underscoring why Nydar's imbalance ratio is a leading indicator of short-term price direction.
Features
Real-Time Updates
Nydar's order book updates live via WebSocket as orders are placed and filled. Watch liquidity shift in real time.
Bid/Ask Spread
Nydar displays the gap between best buy and sell prices. Tight spreads indicate high liquidity.
Depth Visualization
Nydar's visual depth bars show relative order size at each level. Larger bars = more volume.
Cumulative Volume
Nydar shows total volume at and below each price level to help you understand market depth.
Understanding the Order Book
Bid Side (Buy Orders) - Green
The bid side shows all pending buy orders - traders willing to purchase at prices below the current market price. Key points:
- • Listed in descending order (highest bid at top)
- • Highest bid = best price sellers can get immediately
- • Large bid walls can act as support levels
- • More bids = more buying interest = potential support
Ask Side (Sell Orders) - Red
The ask side shows all pending sell orders - traders willing to sell at prices above the current market price. Key points:
- • Listed in ascending order (lowest ask at top)
- • Lowest ask = best price buyers can get immediately
- • Large ask walls can act as resistance levels
- • More asks = more selling pressure = potential resistance
The Spread
The spread is the gap between the highest bid and lowest ask:
- • Tight spread (0.01-0.05%): High liquidity, easy to trade, low slippage
- • Wide spread (0.1%+): Low liquidity, harder to trade, higher slippage
- • Spread widens during volatile periods or low-volume times
- • Major pairs (BTC/USDT) typically have tighter spreads
Reading Order Flow
Identifying Support/Resistance
Nydar's depth bars highlight large orders clustered at specific price levels that often act as support or resistance:
- • Buy wall: Large bid orders at a price level. Price may bounce here.
- • Sell wall: Large ask orders at a price level. Price may reject here.
- • Watch for walls at round numbers ($50,000, $100,000)
- • Walls can be absorbed if momentum is strong enough
Imbalance Detection
Nydar's imbalance ratio compares total volume on bid vs ask side:
- • More bids than asks: Buying pressure, potentially bullish
- • More asks than bids: Selling pressure, potentially bearish
- • Significant imbalance can precede price moves
- • But imbalance alone isn't a trading signal - needs confirmation
Order Book Dynamics
Watch how the order book changes over time:
- • Orders being added = growing interest at that level
- • Orders being removed = traders canceling (pullback or trap)
- • Large orders disappearing quickly = likely market order filled
- • Spoofing: Large orders placed then canceled to manipulate sentiment
Common Use Cases
Finding Entry Prices
Use Nydar's bid wall detection to identify potential support for long entries. Place limit orders just above large bid walls where price is likely to bounce. This can get you a better entry than market buying.
Setting Take-Profit Levels
Use Nydar's sell wall visualisation to identify resistance. Place take-profit orders just below large sell walls where price might struggle to break through.
Assessing Liquidity
Before placing a large order, check Nydar's order book depth. If there's not enough liquidity, your order could cause significant slippage. Consider splitting large orders or using TWAP.
Scalping
Scalpers watch the order book for short-term imbalances. When large orders are being absorbed, it can signal imminent price movement in that direction.
Important Warnings
Spoofing and Manipulation
Large orders in Nydar's order book are not guaranteed to execute. Traders (especially large ones) often place and cancel orders to create false impressions of supply/demand. This is called "spoofing." Never trade solely based on order book data.
Hidden Orders
Many exchanges allow "iceberg" orders that only show a fraction of the total size. Nydar's visible order book may not represent the true liquidity available.
High-Frequency Trading
Nydar's order book changes thousands of times per second. What you see is already slightly outdated. Don't try to compete with algorithmic traders.
Spoofing Detection Guide
Spoofing is the practice of placing large orders with the intent to cancel them before execution. Recognizing spoofing helps you avoid being manipulated by false supply/demand signals.
Disappearing Walls
A large order appears on the bid or ask side, influencing other traders to act, then vanishes within seconds. If you see a massive sell wall at $50,000 that suddenly disappears as price approaches, it was likely a spoof designed to scare sellers.
Detection: Watch how walls behave as price approaches. Real walls get partially filled. Spoofed walls disappear entirely.
Layering
Multiple fake orders placed at several price levels to create the illusion of deep liquidity. For example, large sell orders at $50,100, $50,200, and $50,300 — all designed to discourage buyers.
Detection: If orders at multiple levels appear and disappear simultaneously, they're likely from the same entity.
Flickering Orders
Orders that rapidly appear and disappear (flash orders). They exist for milliseconds — long enough for algorithms to react but too fast for humans to trade against.
Detection: You'll see the best bid/ask price rapidly changing without any trades executing.
Moving Walls
A large order that keeps moving away from the current price. A sell wall at $50,000 jumps to $50,100, then $50,200 as price rises. The wall is designed to create a ceiling illusion but never actually gets filled.
Iceberg Order Detection
Iceberg orders show only a small visible portion of a much larger order. Institutions use them to buy or sell large quantities without revealing their full intent.
Signs of an Iceberg
- • Constant refilling: A 10 BTC order at $49,500 gets filled, and immediately another 10 BTC appears at the same price. This repeats multiple times.
- • Price doesn't move: Heavy selling/buying volume at a specific level, but price barely budges. The order book keeps absorbing trades.
- • Disproportionate trade volume: Time & sales shows 500+ BTC traded at a level where the visible order was only 10 BTC. The rest was hidden.
Why Icebergs Matter
An iceberg bid is quietly accumulating — that's institutional buying. Price is likely to move up once the accumulation is complete. An iceberg ask is institutional distribution — price may drop after. Icebergs at key levels (round numbers, previous highs/lows) are particularly significant.
Quantifying Bid/Ask Imbalance
Rather than just eyeballing which side is "bigger," Nydar calculates a precise imbalance ratio to quantify buying vs selling pressure.
Imbalance Ratio Formula
+0.3 to +1.0
Strong bid dominance
Bullish pressure
-0.3 to +0.3
Balanced
No clear pressure
-1.0 to -0.3
Strong ask dominance
Bearish pressure
How to Use Imbalance Data
- • Trend confirmation: Rising price + positive imbalance ratio = healthy uptrend backed by demand.
- • Divergence warning: Rising price + negative imbalance ratio = price is climbing into heavy sell orders. Potential reversal.
- • Breakout anticipation: Large imbalance building near a key level suggests which direction the breakout is likely to go.
- • Depth comparison: Compare imbalance at different depth levels (top 5 vs top 20 levels) for a fuller picture.
Correlating Order Book with Time & Sales
Nydar's order book shows intent (pending orders). Time & sales shows reality (executed trades). Combining Nydar's order book with executed trade data gives you the full picture.
Bullish Confirmation
Strong bids on the order book + large market buy orders on time & sales = real buying pressure. Price is likely to move up. The tape (time & sales) is confirming what the order book is suggesting.
Bearish Confirmation
Heavy asks on the order book + large market sell orders on time & sales = real selling pressure. The tape confirms distribution.
Divergence (Watch Out)
Large bid walls on the order book but time & sales shows mostly sell-side trades executing. The visible bids might be spoofed — real selling is happening despite the apparent demand. This is a bearish signal despite what the order book shows.
Absorption
A large order sits at a level and absorbs incoming market orders without moving. For example: 500 BTC bid at $49,000 — time & sales shows hundreds of BTC selling into it, but the bid stays. This signals strong institutional buying and often precedes a move up.
Troubleshooting
Nydar's order book not loading
- • Check WebSocket connection status
- • Verify the symbol exists on Binance
- • Try refreshing the widget
Data seems frozen
- • WebSocket may have disconnected - check connection
- • Low-volume symbols may have less frequent updates
- • Refresh the widget to re-establish connection
Pro Tips
- Combine with Nydar's chart analysis: Nydar's order book shows current intent, Nydar's charts show historical context. Use both together for better decisions.
- Watch for wall absorption: When a large wall is being eaten through by market orders, it often signals strong momentum in that direction.
- Check during news events: Order books thin out before major announcements as market makers reduce exposure. Be careful trading during these times.
- Don't front-run walls: Placing orders just in front of large walls is a common strategy, but walls can disappear instantly (spoofing).
- Use for position sizing: If you're trading a significant amount, check if the order book can absorb your order without major slippage.
Order Book vs Other Nydar Widgets
Nydar offers several order flow and depth analysis widgets. Here is how the Order Book compares:
| Feature | Order Book | Level 2 | Aggregated Book | Order Flow | Volume Delta |
|---|---|---|---|---|---|
| Primary focus | Bid/ask depth bars & imbalance | Price ladder with depth | Multi-exchange combined book | Aggressive buy/sell split | Net buying vs selling volume |
| Data source | Single exchange WebSocket | Single exchange stream | Multiple exchange feeds | Real-time trade tape | Aggregated trade data |
| Best for | Support/resistance & liquidity | Scalping & fast execution | Cross-exchange arbitrage | Detecting institutional activity | Trend confirmation |
| Shows pending orders | Yes (full depth) | Yes (ladder format) | Yes (merged) | No (executed trades only) | No (executed trades only) |
| Imbalance metric | Bid/ask ratio (-1.0 to +1.0) | Visual depth comparison | Cross-exchange spread | Buy vs sell volume % | Cumulative delta |
| Time horizon | Seconds to minutes | Seconds to minutes | Seconds to minutes | Seconds to minutes | Minutes to hours |
| Combine with Order Book? | -- | Ladder view of same data | See depth across exchanges | Confirm book intent with actual flow | Validate imbalance with delta trend |
Related Widgets
Further Reading
Last reviewed: February 2026