Earnings Calendar
Nydar's earnings widget tracks upcoming reports, EPS/revenue estimates, and historical beat/miss records
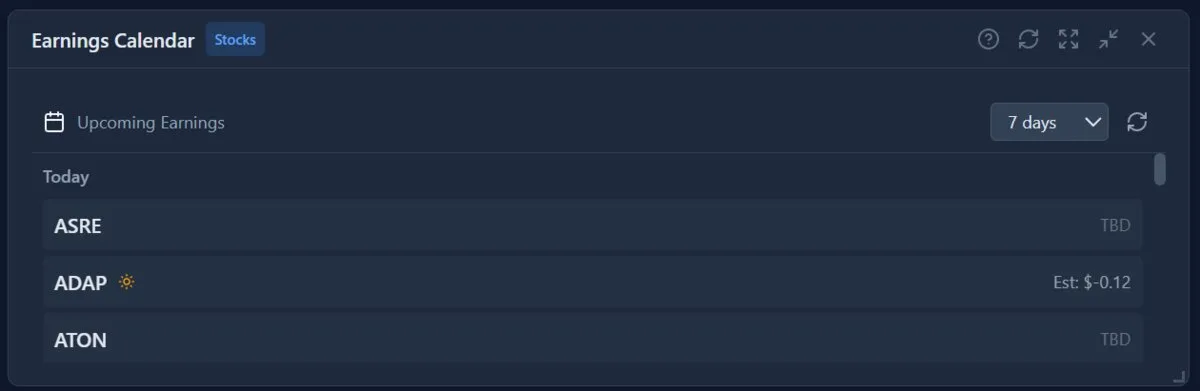
What Is Nydar's Earnings Calendar Widget?
Nydar's Earnings Calendar tracks upcoming and recent earnings reports with EPS estimates, actual results, and surprise percentages for every listed stock. Earnings reports are quarterly announcements where companies reveal their financial performance — revenue, profit, and forward guidance.
Earnings often cause significant price movements. A stock can jump 10%+ on a beat or drop 20%+ on a miss. Nydar flags report timing (BMO/AMC) and beat/miss history so you can plan positions before the numbers land.
Key Earnings Metrics in Nydar
EPS (Earnings Per Share)
Company's profit divided by shares outstanding. The primary metric analysts track. Nydar displays actual EPS vs estimated EPS side by side.
Revenue
Total sales before expenses. Nydar shows whether the company is growing top-line. Revenue miss can hurt even if EPS beats (suggests cost cutting, not growth).
Guidance
Management's forecast for next quarter/year. Nydar tracks guidance revisions because they are often more important than current numbers. Strong guidance = bullish. Weak guidance = bearish even on current beat.
Surprise %
How much actual results differed from estimates. Nydar calculates this automatically: +5% surprise = beat by 5%. -10% surprise = missed by 10%. Bigger surprises = bigger price moves.
Report Timing in Nydar
Before Market Open (BMO)
Nydar flags reports released before 9:30 AM ET. Stock reacts at market open. Pre-market trading shows initial reaction.
After Market Close (AMC)
Nydar flags reports released after 4:00 PM ET. Stock reacts next trading day. After-hours trading shows initial reaction.
Earnings Call
Conference call with management, usually 30-60 min after numbers released. Q&A session often reveals important details not in the press release.
Earnings Seasons on Nydar
Nydar's calendar covers all four quarterly reporting periods. Most companies report on similar schedules:
- Q1 Earnings: Mid-April to mid-May (Jan-Mar quarter)
- Q2 Earnings: Mid-July to mid-August (Apr-Jun quarter)
- Q3 Earnings: Mid-October to mid-November (Jul-Sep quarter)
- Q4 Earnings: Mid-January to mid-February (Oct-Dec quarter)
Major companies (AAPL, MSFT, GOOGL, AMZN) typically report in the middle of earnings season. Their results can move the entire market.
Trading Around Earnings with Nydar
Pre-Earnings Strategies
- Buy ahead of expected beat (risky - already priced in?)
- Sell before to avoid uncertainty
- Buy straddles to profit from big move either direction
Post-Earnings Strategies
- Buy the dip on overreaction to slight miss
- Ride momentum after strong beat + guidance
- Fade the gap when initial move is overdone
Earnings Risks Nydar Helps You Manage
- Gap risk: Stock can gap 10-20% overnight. Nydar's data shows the move after the fact — stop losses don't protect against gaps.
- IV crush: Options lose value after earnings due to implied volatility drop, even if you're right on direction.
- Beat and drop: Nydar's surprise data may show a beat, but the stock can still fall if expectations were too high or guidance disappoints.
- Miss and rally: Nydar's surprise data may show a miss, but the stock can still rise if expectations were too low or guidance improves.
Using Nydar's Earnings Calendar
Upcoming Earnings
Nydar lists scheduled earnings for stocks in your watchlist or any symbol you search for.
Historical Results
Nydar shows past earnings: EPS estimates, actual results, and surprise percentage side by side.
Earnings Alerts
Nydar's Alert Builder lets you set reminders for earnings dates so you're never caught off guard.
Pro Tips
- Check the whisper number: Sometimes expectations on trading floors are higher than official estimates.
- Watch peer reactions: If NVDA beats, AMD and other semis often move too. Use Nydar's Heatmap widget to spot sector sympathy.
- Size down before earnings: If holding through, reduce position size to manage gap risk. Nydar's Position Size Calculator helps.
- Read the call transcript: Numbers are just numbers. Management tone and guidance details matter more.
- Track beat/miss history: Nydar's historical results show which companies consistently beat. The market expects it. A mere meet is treated as miss.
- Don't FOMO: Missing one earnings move is fine. There's always next quarter.
Post-Earnings Announcement Drift (PEAD)
One of the most well-documented market anomalies: stocks that beat earnings tend to continue drifting higher for 60-90 days, and stocks that miss tend to keep falling. First identified by Ball and Brown (1968, "An Empirical Evaluation of Accounting Income Numbers," Journal of Accounting Research, 6(2), 159-178), PEAD was later confirmed by Bernard and Thomas (1989, "Post-Earnings-Announcement Drift: Delayed Price Response or Risk Premium?", Journal of Accounting Research, 27, 1-36), who showed the drift persists even after controlling for risk factors.
Positive PEAD
Stocks with large positive earnings surprises (+10% beat) tend to outperform the market by 2-5% in the 60 days following the report. The market underreacts to good news.
Negative PEAD
Stocks with large negative surprises (-10% miss) tend to underperform by 3-7% in the following 60 days. The market underreacts to bad news too.
Trading PEAD
Wait 1-3 days after earnings for the initial volatility to settle. If the stock gapped up and held its gains with strong volume, the drift is likely to continue. Enter on the first pullback after earnings day.
Earnings Quality: Beyond the Headlines
Not all earnings beats are created equal. Dig deeper to assess quality:
Revenue Growth vs Cost Cutting
A company that beats EPS by cutting costs but missed on revenue is less bullish than one that beat both. Revenue growth is harder to fake and indicates real demand.
Operating vs Non-Operating Income
Check if the beat came from core operations or one-time items (asset sales, tax benefits, accounting adjustments). Sustainable earnings come from operations.
Forward Guidance Revisions
Management raising guidance is the strongest bullish signal. Lowering guidance — even when beating current quarter — is bearish. The market prices in the future, not the past.
Estimate Revisions Trend
Check if analysts have been raising or lowering estimates leading up to earnings. A stock beating lowered estimates is less impressive than beating estimates that were already rising (the "whisper" was even higher).
Interpreting Reactions in Nydar
Bullish Reaction
Nydar's Chart widget shows the stock gapping up and holding/continuing higher. Volume confirms buyers stepping in. Often leads to extended move over following days.
Bearish Reaction
Nydar's Chart widget shows the stock gapping down and continuing lower. Sellers overwhelm buyers. May find support at technical levels or prior earnings gaps.
Reversal Reaction
Nydar's intraday chart shows the stock gapping one way but reversing during the day. Initial reaction was overdone. These can be powerful trading opportunities.
How the Earnings Calendar Compares to Other Nydar Widgets
| Feature | Earnings Calendar | Stock Info | Analyst Ratings | Signals | News |
|---|---|---|---|---|---|
| Primary purpose | Upcoming report dates | Company fundamentals | Analyst consensus | Technical signals | Breaking headlines |
| Time horizon | Quarterly events | Current snapshot | 12-month targets | Short-term (1-5 days) | Real-time |
| Key metric | EPS surprise % | P/E, market cap | Buy/hold/sell ratio | ML confidence score | Sentiment score |
| Use before earnings | Plan entry/exit timing | Check valuation | Gauge expectations | Confirm direction | Check for leaks |
| Use after earnings | Track PEAD drift | Compare to results | Watch revisions | Confirm breakout | Gauge reaction |
| Update frequency | Daily / on report | Real-time | Weekly | Real-time | Real-time |
| Ideal pairing | Stock Info, Chart | Earnings, Analyst | Earnings, Stock Info | Chart, Earnings | Earnings, Watchlist |
Related Widgets
Further Reading
Last reviewed: March 2026