What is Swing Trading?
Swing trading is a style where you hold positions for several days to several weeks, aiming to profit from "swings" in price. Unlike day traders who close positions daily, swing traders ride the intermediate-term trends.
The goal is to capture a chunk of a potential price move - typically 5-20% gains on stocks, or significant moves in crypto/forex. You're not trying to catch the exact bottom or top, just the meaty middle of the move.
Hold Time
2-20 days typical
Trades/Month
4-12 trades
Time Required
30-60 min/day
Swing Trading vs Day Trading
| Factor | Day Trading | Swing Trading |
|---|---|---|
| Hold Time | Minutes to hours | Days to weeks |
| Screen Time | Full market hours | 30-60 min/day |
| Capital Needed | $25K+ (stocks) | $5K+ recommended |
| Profit Targets | 0.5-2% | 5-20% |
| Overnight Risk | None | Yes (gaps possible) |
| Stress Level | High | Moderate |
Swing trading is ideal if you have a full-time job and can't watch markets all day. You can analyze charts in the evening, place orders, and check positions once or twice daily.
Best Markets for Swing Trading
Stocks
Mid-cap stocks ($2B-$10B market cap) are ideal - they have enough volatility to move but enough liquidity to exit easily. Avoid penny stocks and mega-caps (too slow).
Cryptocurrency
Crypto is excellent for swing trading due to 24/7 markets and high volatility. BTC, ETH, and top 20 altcoins work best. Be aware that crypto can gap significantly on weekends.
Forex
Currency pairs like EUR/USD, GBP/USD are popular for swing trading. Movements are smaller, so traders often use leverage. Watch for central bank announcements.
Key Technical Indicators for Swing Trading
Moving Averages (20 & 50 EMA)
The 20-day EMA shows short-term trend, 50-day shows intermediate trend. Price above both = bullish. Look for pullbacks to the 20 EMA as entry points in uptrends.
Entry signal: Price bounces off 20 EMA with a bullish candle
RSI (Relative Strength Index)
RSI below 30 = oversold (potential buy), above 70 = overbought (potential sell). In strong trends, RSI can stay overbought/oversold for extended periods.
Entry signal: RSI crosses above 30 from oversold while in uptrend
MACD
MACD shows momentum and trend direction. Bullish when MACD line crosses above signal line. Histogram shows strength of the move.
Entry signal: MACD bullish crossover below zero line
Bollinger Bands
Bands squeeze before big moves. Price touching lower band in uptrend = potential buy. Price at upper band = potential resistance.
Entry signal: Price touches lower band and bounces with volume
Entry and Exit Strategies
Entry Strategies
Exit Strategies
Position Sizing for Swing Trades
Proper position sizing is critical because swing trades face overnight risk. Use this formula:
Position Size = (Account × Risk%) ÷ (Entry - Stop Loss)
Example: $50,000 account, 1% risk ($500), buying at $100 with stop at $95 (risk per share = $5)
Position Size = $500 ÷ $5 = 100 shares ($10,000 position)
Overnight Gap Risk
Stocks can gap 5-10%+ on earnings or news. Consider avoiding positions through known events (earnings, FDA decisions) or reducing position size to account for gap risk.
Using AI Signals for Swing Trades
AI and machine learning can enhance your swing trading by:
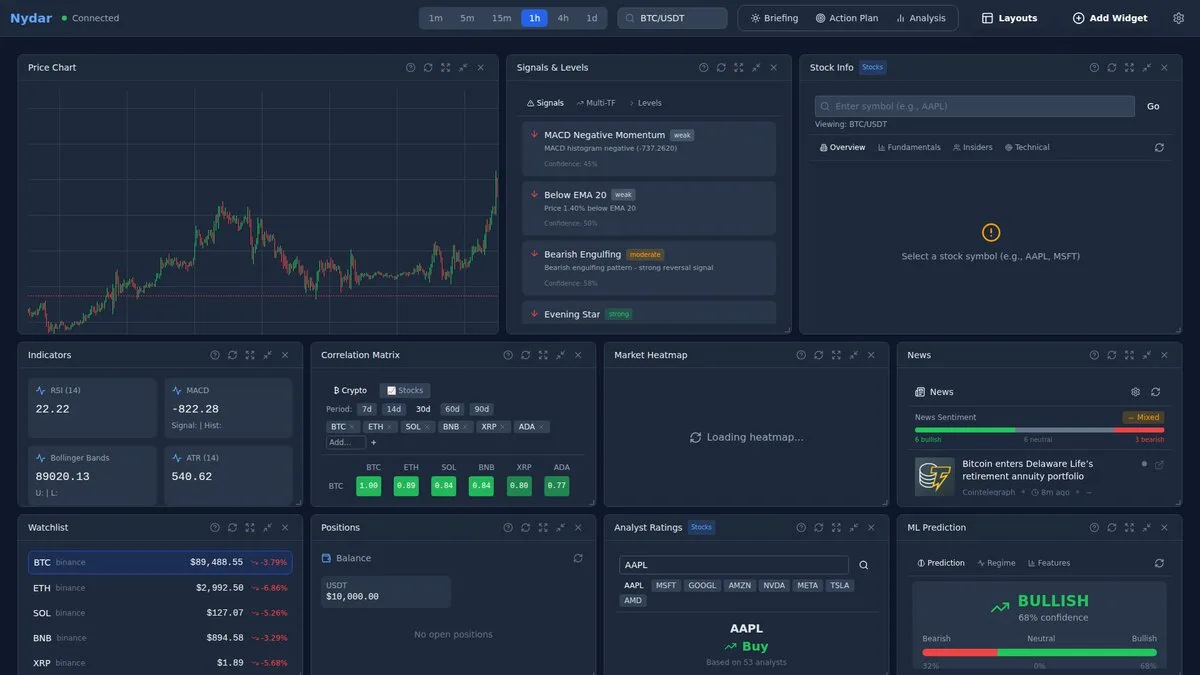
Nydar's AI generates swing trade signals with confidence scores, entry points, stop losses, and profit targets. Use these as a starting point for your own analysis - never trade signals blindly.
Further Reading
- Investopedia: Swing Trading definition and strategies — Entry, exit, and hold-period strategies
- Investor.gov: How stock markets work — Official US investor education resource
Written by Ryan Clinton
Founder of Nydar. Software engineer with experience at Cowen Inc (Wall Street) and on large-scale infrastructure projects. Built Nydar to make professional trading tools accessible to everyone.
Last reviewed: March 2026