Funding & Open Interest
Nydar's funding rate and open interest widget tracks crypto derivatives positioning and sentiment in real time
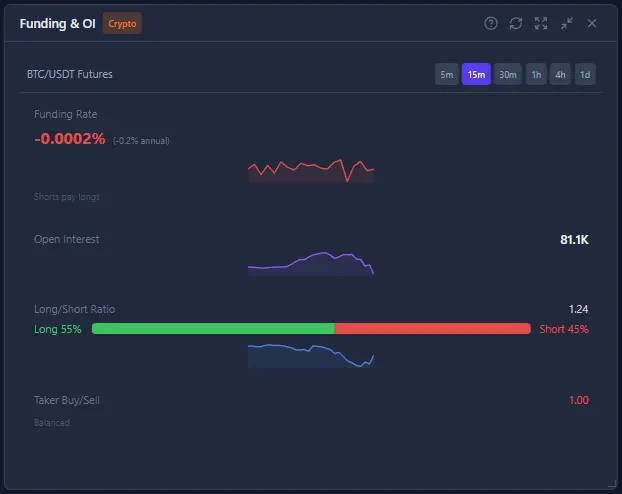
What Is Nydar's Funding & OI Widget?
Nydar's Funding & OI widget combines 4 derivatives metrics — funding rate, open interest, long/short ratio, and taker buy/sell volume — into a single real-time view of leveraged positioning across major crypto perpetual futures markets.
Funding rate extremes, open interest spikes, and lopsided long/short ratios often precede sharp reversals. Nydar surfaces these signals as they develop so you can act before the crowd gets liquidated.
The mechanics of perpetual futures and their funding rate mechanism are thoroughly documented in John C. Hull's Options, Futures, and Other Derivatives (11th ed., Pearson, 2022), which remains the standard reference for derivatives pricing and settlement structures. For empirical analysis of how open interest predicts crypto volatility, see Alexander & Heck, "The Role of Futures Trading Activity in Cryptocurrency Spot Market Volatility" (Journal of Futures Markets, vol. 40, no. 7, 2020, pp. 1027-1051). The relationship between leveraged positioning and liquidation cascades is explored in Białkowski et al., "Leveraged Trading and Market Stability in Cryptocurrency Derivatives" (Finance Research Letters, vol. 47, 2022).
Nydar's Key Derivatives Metrics
Funding Rate
Nydar tracks the periodic fee paid between longs and shorts to keep perpetual futures prices aligned with spot. Positive funding = longs pay shorts (bullish crowding). Negative funding = shorts pay longs (bearish crowding). Nydar flags extreme rates that often precede mean reversion.
Open Interest
Nydar displays the total value of outstanding futures contracts. Rising OI with rising price = new longs entering (trend strength). Rising OI with falling price = new shorts entering. Falling OI = positions closing (trend weakening).
Long/Short Ratio
Nydar calculates the ratio of long to short positions among top traders and accounts. Extreme readings (above 2.0 or below 0.5) indicate crowded positioning that Nydar highlights as vulnerable to a squeeze.
Taker Buy/Sell Volume
Nydar measures the ratio of aggressive buying to selling in the futures market. Nydar's taker volume data shows real-time directional conviction from leveraged traders.
Nydar's Signals to Watch
Pro Tips
- Nydar flags funding rate extremes above 0.1% or below -0.1% per 8h as significant
- Use alongside Nydar's Liquidation Map to see where crowded positions will break
- When Nydar shows OI dropping during a move, that's profit-taking, not new conviction
- Compare Nydar's top trader ratio vs account ratio — divergences reveal smart money positioning
- Nydar's Funding & OI data is most useful during range-bound periods to anticipate the breakout direction
How Funding & OI Compares to Other Nydar Widgets
| Feature | Funding & OI | Liquidation Map | Footprint Chart | Level 2 / Order Book | Fear & Greed |
|---|---|---|---|---|---|
| Primary Focus | Nydar's derivatives positioning | Liquidation price clusters | Volume at price level | Live bid/ask depth | Aggregate sentiment |
| Data Source | Exchange futures API | Estimated from OI | Trade-by-trade tape | Order book snapshots | Multi-factor index |
| Update Frequency | Every 30 seconds | Real-time | Real-time | Real-time | Hourly |
| Asset Coverage | Crypto perpetuals | Crypto perpetuals | Crypto & stocks | Crypto & stocks | Crypto only |
| Best For | Nydar's squeeze detection | Cascade targets | Aggressive vs passive | Immediate supply/demand | Macro mood |
| Pairs Well With | Liquidation Map | Funding & OI | Volume Delta | Order Flow | Funding & OI |
Related Nydar Topics
Further Reading
Last reviewed: March 2026