Order Flow
Nydar's Order Flow widget detects large trades exceeding 2x average size, reconstructs fragmented institutional orders, and streams real-time buy/sell tape across 200+ crypto pairs at 2-second intervals
What Is Nydar's Order Flow Widget?
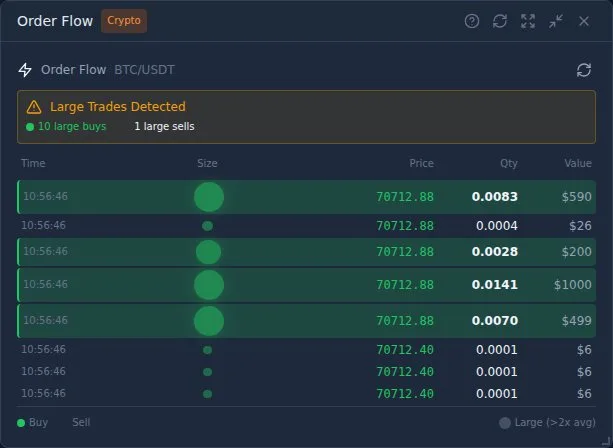
Nydar's Order Flow widget is a real-time large trade detector that streams every executed trade for 200+ cryptocurrency pairs, flags trades exceeding 2x the rolling average size as institutional-grade activity, and reconstructs fragmented exchange fills into their original parent orders using a 500-millisecond grouping window. The widget processes the most recent 200 trades per refresh, updates every 2 seconds via WebSocket, and displays each trade's direction (buy or sell), price, quantity, dollar value, and relative size as a visual bubble. Order flow analysis reveals the actual transactions driving price — as distinct from what candlestick charts show after the fact. This distinction is central to market microstructure theory as described by Maureen O'Hara in Market Microstructure Theory (Blackwell, 1995), where the trade tape is where price discovery becomes visible.
Nydar's Order Flow widget operates in 2 view modes: Raw (individual fills as reported by the exchange) and Reconstructed (fragmented fills merged back into parent orders). The Reconstructed mode uses Nydar's order reconstruction algorithm to group trades at the same price and direction within 500 milliseconds, achieving compression ratios typically between 1.5x and 4x — meaning a single institutional order that the exchange split into 4 fills appears as 1 consolidated entry with the true total size. Larry Harris documents this fill fragmentation pattern extensively in Trading and Exchanges (Oxford, 2003), noting that exchanges routinely break large market orders into multiple partial fills against resting limit orders at the same price level.
What Features Does Nydar's Order Flow Widget Include?
Nydar flags buy-side trades exceeding 2x the average trade size calculated from the most recent 200 trades. Multiple large buys in quick succession — particularly when price remains flat — indicates institutional accumulation. Nydar displays the count of detected large buys in a highlighted alert banner at the top of the widget.
Nydar flags sell-side trades exceeding 2x the average trade size. Clusters of large sells during price rallies indicate distribution — smart money selling into strength. Nydar tracks the last 10 large buys and last 10 large sells separately, each with price, quantity, and timestamp.
Nydar's reconstruction algorithm groups fragmented fills at the same price and direction within a 500ms time window into consolidated parent orders. The widget displays the fragment count per reconstructed order, a compression ratio showing how many raw fills were merged (e.g., "12 orders reconstructed from 47 fills, 3.9x compression"), and marks each entry as either single-fill or multi-fragment. This reveals the true institutional order size that raw exchange data obscures.
Nydar streams a live tape of the 50 most recent trades showing time (HH:MM:SS), price, quantity, dollar value, and buy/sell direction. Each trade's relative size is represented as a proportional bubble — larger bubbles indicate trades further above the average. Trades are grouped by minute for easier visual scanning. Nydar color-codes buys (green) and sells (red) for instant directional reading.
Nydar renders each trade as a bubble with diameter proportional to its size relative to the rolling average. The bubble size ranges from 5px (smallest trades) to 30px (largest), with the formula scaling linearly from the average trade size. A trade at 3x the average appears roughly 3x the diameter of an average-sized trade, making institutional orders visually obvious without reading the numbers.
How to Read Nydar's Order Flow Data
- 1.Watch Nydar's large trade alerts for clusters of buys or sells in the same direction — 1 large trade is noise, but 3-5 large buys within 2 minutes is a signal of institutional accumulation
- 2.Switch to Reconstructed view mode to see the true parent order sizes after Nydar merges fragmented fills — a compression ratio above 2x indicates significant fill fragmentation, meaning institutions are active
- 3.Compare large trade direction to price action — if price is falling but Nydar detects large buys, accumulation is happening (institutions buying at lower prices before an expected reversal)
- 4.Use Nydar's Order Flow alongside the Volume Delta widget for confirmation — large buys in Order Flow combined with rising cumulative volume delta in the Volume Delta widget creates a stronger signal than either alone
- 5.Large trades at key support and resistance levels identified on Nydar's price chart are especially significant — institutions place the largest orders where liquidity is deepest, typically at round numbers and prior swing highs/lows
Order Flow vs Other Nydar Widgets
Nydar provides 7 order flow widgets. Each reveals a different dimension of market microstructure. The table below shows how Order Flow compares to the 6 related widgets available on Nydar's dashboard.
| Widget | Data Source | Shows | Best For |
|---|---|---|---|
| Order Flow | Executed trades (200 most recent) | Large trades, buy/sell tape, reconstructed orders | Detecting institutional entries/exits in real time |
| Volume Delta | Cumulative buy vs sell volume | Net buying/selling pressure over time | Spotting divergences between price and pressure |
| Order Book (Level 2) | Pending limit orders (up to 5,000 levels) | Bid/ask depth, walls, imbalances | Seeing where liquidity sits before trades execute |
| Footprint Chart | Bid/ask volume per candle per price level | Aggressive buying/selling inside each candle | Decomposing candles into buyer vs seller aggression |
| Liquidation Map | Estimated leveraged position clusters | Where forced closures will cascade | Anticipating squeeze events and stop-runs |
| Aggregated Book | Multi-venue combined depth | True available liquidity across exchanges | Assessing total market depth beyond a single venue |
| Market Replay | 150 historical order book snapshots | How the book evolved before a move | Post-trade analysis and pattern recognition |
How to Read Large Trade Patterns on Nydar
Accumulation Pattern
Nydar's Order Flow widget shows accumulation when multiple large buys (each exceeding 2x average size) appear over 5-15 minutes while price stays flat or dips slightly. Smart money accumulates without pushing price up — expect an eventual breakout upward. In Reconstructed mode, accumulation orders often show high fragment counts (4-8 fills per order), indicating the institution split a single large order across multiple fills to minimize market impact. Richard Wyckoff documented this accumulation-distribution cycle in the 1930s, and the pattern remains the foundation of institutional order flow analysis.
Distribution Pattern
Nydar detects distribution when large sells appear during price rallies — smart money selling into strength. Each bounce gets sold into with progressively larger orders. Nydar's large trade alert shows the sell count climbing while the buy count stays flat. Expect an eventual breakdown once distribution is complete. Distribution typically takes 2-4x longer than accumulation because sellers need willing buyers at each price level.
Stop Hunt Pattern
Nydar's Order Flow reveals stop hunts as a burst of large sells that push price through a support level (triggering stop losses), immediately followed by aggressive large buys. The widget shows a rapid shift from sell-heavy to buy-heavy large trades within 1-3 minutes. This is a classic institutional liquidity-gathering pattern — the stop-triggered sells provide the liquidity institutions need to fill large buy orders at discount prices. In crypto markets, where leverage ratios of 10-100x are common, stop hunts can trigger cascading liquidations that move price 5-15% in minutes.
Absorption Pattern
Nydar's Order Flow widget identifies absorption when large sell orders hit the market but price does not decline — indicating a large buyer is absorbing the selling pressure at the current level. The widget shows a steady stream of large sells (red) while the price column remains flat. This is a strong bullish signal because it means a buyer with size larger than the aggregate sellers is defending a price level. Nydar's backend uses a 3x average volume threshold to flag absorption candidates in the order book analysis engine.
Technical Specifications
Pro Tips for Nydar's Order Flow Widget
- Nydar's "large" trade threshold adapts automatically — it is 2x the rolling average of the most recent 200 trades, not a fixed dollar amount
- Switch between Raw and Reconstructed view modes using the toggle in the top-right corner — Recon mode reveals institutional orders hidden by exchange fill fragmentation
- Nydar's Order Flow is most useful for short-term trading and scalping on 1-minute to 15-minute timeframes where individual trade detection matters
- Pair Nydar's Order Flow widget with the Footprint Chart to see both the individual large trades (Order Flow) and the aggregate bid/ask volume at each price level (Footprint)
- Use Nydar's Volume Profile widget to identify high-volume price nodes, then watch for large trades at those levels in Order Flow — institutions target liquidity-rich zones for execution
Why Use Nydar's Order Flow Instead of Chart Analysis Alone?
Traditional candlestick charts show completed candles — by definition, the information is lagging. Nydar's Order Flow widget shows individual trades as they execute in real time, before candles complete. This distinction matters because price charts compress all trading activity into a single OHLC bar, while order flow decomposes that bar into its constituent transactions. As documented in Marcos Lopez de Prado's Advances in Financial Machine Learning (Wiley, 2018), trade-level data contains information that aggregated bar data discards — particularly the sequence and size distribution of individual fills.
The most effective approach on Nydar combines both: use Nydar's price chart with 105 indicators for trend context (direction, structure, support/resistance levels) and Nydar's Order Flow for real-time execution timing (when large players are entering and exiting positions).
Learn More About Order Flow on Nydar
Deepen your understanding of order flow analysis with these Nydar guides:
Complete guide to institutional order flow on Nydar
Confirm Nydar's order flow signals with volume patterns
Short-term trading where Nydar's order flow detection shines
How order matching and price discovery work at the exchange level
Related Nydar Widgets and Topics
Further Reading
Last reviewed: 29 March 2026