Institutional Holdings
Nydar's institutional holdings widget tracks quarterly 13F filings from 500+ funds including position changes and new entries
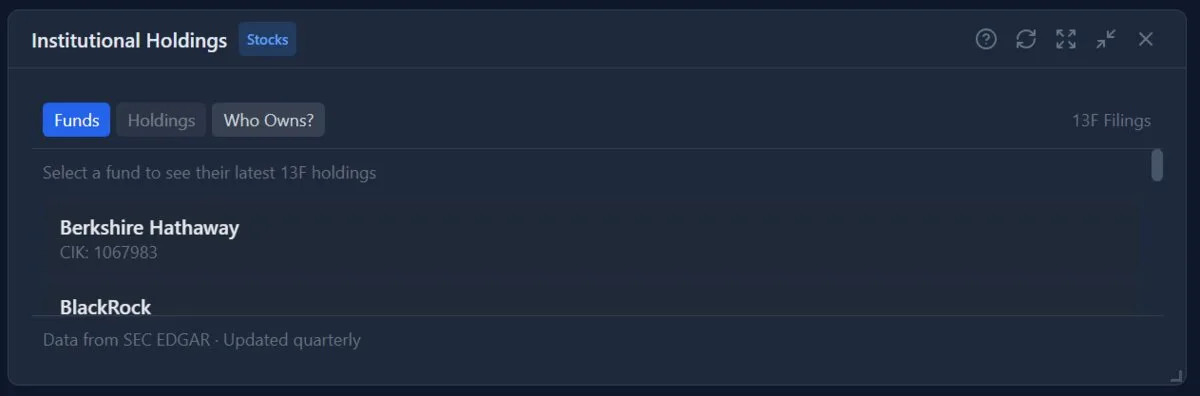
What Is Nydar's Institutional Holdings Widget?
Nydar's Institutional Holdings widget aggregates SEC 13F, 13D/13G, and Form 4 filings from 500+ hedge funds, mutual funds, and pension funds into one view — showing ownership percentages, quarterly position changes, and insider transactions for any US-listed stock.
The predictive value of insider trading data was established by Lakonishok & Lee in "Are Insider Trades Informative?" (Review of Financial Studies, vol. 14, no. 1, 2001, pp. 79-111), which found that insider purchases predict positive abnormal returns of 4-7% over the following 12 months. For institutional herding behaviour, see Nofsinger & Sias, "Herding and Feedback Trading by Institutional and Individual Investors" (The Journal of Finance, vol. 54, no. 6, 1999, pp. 2263-2295). The impact of activist 13D filings on stock prices is documented in Brav et al., "Hedge Fund Activism, Corporate Governance, and Firm Performance" (The Journal of Finance, vol. 63, no. 4, 2008, pp. 1729-1775).
Nydar's Data Sources
13F Filings
Nydar aggregates quarterly filings required for institutions managing $100M+. Shows exact holdings.
13D/13G Filings
Nydar tracks filings when an investor acquires 5%+ of a company. Shows activist positions.
Insider Transactions
Nydar displays Form 4 filings showing executive and director trades.
Nydar's Key Metrics
Institutional Ownership %
Nydar calculates the percentage of shares held by institutions. Higher % means more institutional interest.
Number of Holders
Nydar tracks the count of institutions holding the stock. More holders = more diversified ownership.
Quarterly Changes
Nydar shows net buying or selling by institutions quarter over quarter, surfacing sentiment shifts.
Top Holders
Nydar displays the largest institutional shareholders and their position sizes.
Notable Investors Tracked by Nydar
Interpreting Ownership Changes
Quarterly changes in institutional ownership tell a story. Here's how Nydar helps you read it:
Accumulation Signals (Bullish)
- • Number of institutional holders increasing over 2+ quarters
- • Total institutional ownership % rising steadily
- • New positions opened by well-known funds
- • Existing holders increasing position sizes
Distribution Signals (Bearish)
- • Number of holders declining quarter over quarter
- • Large funds reducing or closing positions
- • Total shares held by institutions decreasing
- • Insider selling coinciding with institutional selling
Caution: Context Matters
A fund selling stock doesn't always mean they're bearish. They might be rebalancing, meeting redemptions, or trimming to stay within risk limits. Look at the broader pattern across multiple funds, not individual moves.
Nydar's Smart Money Signals
Cluster Buying
Nydar's cluster detection flags when 3+ respected funds initiate new positions in the same stock during the same quarter. This suggests independent analysis arrived at the same bullish conclusion.
Insider + Institutional Alignment
When Nydar's data shows company insiders buying alongside increasing institutional ownership, it's one of the strongest bullish signals. Insiders know the business best.
Activist Investor Entry
A 13D filing means someone took a 5%+ stake with intent to influence the company. This often precedes significant changes and can be a catalyst for stock price appreciation.
Contrarian Signal
Sometimes the smart money is wrong, or they buy early. Use Nydar's quarterly comparison to track whether institutional buying coincided with price increases (following the smart money) or decreases (they were early/wrong).
Important Notes
- 45-day delay: 13F filings are due 45 days after quarter end, so Nydar's data is always delayed by this regulatory timeline.
- Not real-time: Institutions may have already changed positions since filing. Nydar's data reflects the most recent available filings.
- Hedging not shown: Options and short positions aren't required in 13F filings, so Nydar's holdings view only covers long equity positions.
- Context matters: A sale might be rebalancing, not a negative view on the company.
Pro Tips
- Track trends: Use Nydar's quarter-over-quarter view to see if institutions are accumulating or distributing.
- Watch for clusters: Nydar flags when multiple top funds buy the same stock — one of the strongest signals.
- Check insider buys: Nydar's insider transaction data shows when executives buy their own stock, which is often bullish.
- Combine with fundamentals: Use Nydar's institutional data alongside Nydar's Stock Info widget for your own analysis.
Learn More on Nydar
Deepen your understanding with Nydar's learning guides:
How Institutional Holdings Compares to Other Nydar Widgets
| Feature | Institutional Holdings | Congressional Trading | Insider Clusters | Activist Tracker | Dark Pool |
|---|---|---|---|---|---|
| Primary Focus | 13F fund holdings | Lawmaker stock trades | Multi-insider buy clusters | 13D activist campaigns | Off-exchange block trades |
| Data Source | SEC 13F filings | STOCK Act disclosures | SEC Form 4 filings | SEC 13D/13G filings | FINRA ATS data |
| Update Frequency | Quarterly (45-day lag) | Within 45 days of trade | Within 2 business days | Within 10 days of 5% | T+1 settlement |
| Coverage | 500+ funds tracked | 535 members of Congress | All SEC Form 4 filers | Activist 5%+ holders | 40+ ATS venues |
| Best For | Smart money trends | Policy-informed trades | High-conviction signals | Catalyst events | Hidden accumulation |
| Pairs Well With | Stock Info | Institutional Holdings | Institutional Holdings | News Feed | Order Flow |
Related Nydar Widgets
Further Reading
Last reviewed: February 2026