Stock Info
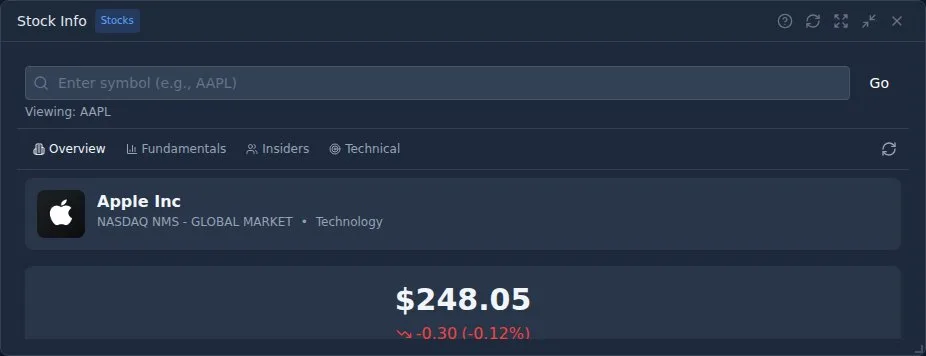
Nydar's stock info widget provides company profiles, fundamentals, insider trading data, and technical analysis in one view
What Is Nydar's Stock Info Widget?
Nydar's Stock Info widget packs company profiles, 6 valuation metrics, 3 financial health ratios, insider transaction history, and automated chart pattern detection into 4 tabs — Overview, Fundamentals, Insiders, and Technical — giving you a full research snapshot for any US-listed stock.
Nydar's Stock Info widget is specifically for equities (not crypto). Select a stock symbol from your Nydar watchlist or Nydar chart to load its data.
The valuation framework used in Nydar's Fundamentals tab draws from Benjamin Graham & David Dodd's Security Analysis (1st ed., McGraw-Hill, 1934), which established the discipline of fundamental analysis and introduced metrics like price-to-earnings and price-to-book ratios that remain standard today. For modern applications of these ratios, see Fama & French, "The Cross-Section of Expected Stock Returns" (The Journal of Finance, vol. 47, no. 2, 1992, pp. 427-465), which demonstrated that book-to-market equity and firm size explain average stock returns better than beta alone. The insider trading signals in the Insiders tab are supported by Seyhun's Investment Intelligence from Insider Trading (MIT Press, 1998).
Overview Tab
Company Profile
Nydar's Stock Info widget shows the company logo, name, exchange, and industry. Gives you instant context about what the company does and where it's listed.
Current Price & Change
Real-time price with daily change in both dollar and percentage terms. Green indicates up, red indicates down.
Today's Range
Nydar displays a visual bar showing where the current price sits between today's high and low. Also shows open and previous close prices.
Company Info
Key details including market cap, country, currency, IPO date, and website link.
Fundamentals Tab
Valuation Metrics
- P/E Ratio (TTM): Price-to-Earnings ratio. Lower may indicate undervaluation.
- P/B Ratio: Price-to-Book ratio. Compares market value to book value.
- P/S Ratio: Price-to-Sales ratio. Useful for unprofitable companies.
- EPS (TTM): Earnings Per Share over trailing 12 months.
- Dividend Yield: Annual dividend as percentage of stock price.
- Beta: Volatility relative to the market. Above 1 = more volatile.
Growth Metrics
Nydar's Stock Info widget shows year-over-year EPS growth and revenue growth. Positive growth (green) indicates the company is expanding. Negative growth (red) may signal trouble or a cyclical downturn.
Margins
Nydar displays visual bars showing gross margin, operating margin, and net margin. Higher margins generally indicate better profitability and competitive advantages.
Financial Health
- Current Ratio: Assets/Liabilities. Above 1 is healthy (green), below 1 is risky (red).
- Quick Ratio: Like current ratio but excludes inventory. Stricter test of liquidity.
- Debt/Equity: Lower is better. Below 0.5 is green, above 1 is red.
52-Week Range
Nydar shows where the current price sits relative to its 52-week high and low. A stock near its 52-week high may have momentum; near its low may be oversold or troubled.
Insiders Tab
Nydar's Insiders tab tracks what company executives and major shareholders are doing with their own stock. Nydar sources insider trading data from SEC Form 3, 4, and 5 filings.
Insider Sentiment (MSPR)
The Monthly Share Purchase Ratio (MSPR) ranges from -100 to +100:
- Above +50: Strong Buying - Insiders are aggressively buying shares
- +20 to +50: Moderate Buying - Net positive insider activity
- -20 to +20: Neutral - Balanced buying and selling
- -50 to -20: Moderate Selling - Net negative insider activity
- Below -50: Strong Selling - Insiders are aggressively selling
Activity Summary
Nydar displays quick stats showing total buy transactions, sell transactions, and net shares bought or sold. Green indicates net buying; red indicates net selling.
Recent Transactions
Nydar lists individual transactions showing who traded, when, how many shares, and at what price. Transaction codes include:
- Purchase (P): Direct open market buy
- Sale (S): Direct open market sell
- Grant/Award (A): Stock compensation (common for executives)
- Gift (G): Stock transferred as gift
- Conversion (M/C): Options exercised or converted
Understanding Insider Activity
- Buying is more significant than selling: Insiders buy for one reason (they expect the stock to go up), but sell for many reasons (diversification, taxes, personal needs).
- Watch for clusters: Multiple insiders buying around the same time is more meaningful than one person buying.
- Grants aren't purchases: Stock awards (A) are compensation, not a vote of confidence.
- Check who's buying: CEO and CFO purchases are more significant than lower-level executives.
Technical Tab
Nydar's automated technical analysis scans for key support/resistance levels and 5 chart pattern types (head and shoulders, double top/bottom, triangles, wedges, and channels). Nydar's pattern data is algorithmically generated — use it as a starting point for your own analysis.
Support & Resistance Levels
Nydar shows the 5 nearest support levels (below current price) and resistance levels (above current price). Each level shows:
- Price Level: The exact price where support/resistance is detected
- Distance %: How far the level is from current price
Chart Pattern Detection
Nydar automatically detects common chart patterns including:
- Head and Shoulders: Reversal pattern with three peaks
- Double Top/Bottom: Two peaks/troughs at similar levels
- Triangles: Ascending, descending, or symmetrical consolidation
- Wedges: Rising or falling wedge patterns
- Channels: Price moving between parallel trend lines
Each pattern shows whether it's bullish or bearish, along with suggested entry price, stop loss, and target price when available.
Using Technical Levels
- Entry planning: Wait for price to reach support before buying, or resistance before selling.
- Stop loss placement: Place stops just below support (for longs) or above resistance (for shorts).
- Pattern confirmation: Don't trade patterns until they confirm (e.g., breakout from a triangle).
- Multiple timeframes: Levels that appear on daily and weekly charts are stronger.
Quick Valuation Guide
Not sure what "good" fundamental values look like? Use Nydar's quick reference as a rough guide:
| Metric | Value | Attractive | Expensive |
|---|---|---|---|
| P/E Ratio | Earnings multiple | <15 | >30 |
| P/B Ratio | Book value multiple | <1.5 | >5 |
| Debt/Equity | Leverage ratio | <0.5 | >2.0 |
| Current Ratio | Liquidity measure | >2.0 | <1.0 |
| Net Margin | Profit efficiency | >15% | <5% |
| Dividend Yield | Income return | 2-5% | >8% (may be unsustainable) |
These ranges are generalizations. Tech and growth stocks typically trade at higher multiples. Compare within the same sector for meaningful comparisons.
Building a Complete Picture
Each of Nydar's 4 tabs tells a different part of the story. Combine them for better decisions:
Bullish Setup
Strong fundamentals (low P/E, high margins, low debt) + insider buying + bullish chart patterns + price near support = high conviction buy candidate. Combine with Analyst Ratings consensus Buy for additional confirmation.
Bearish Warning Signs
Deteriorating margins + insider selling (especially by CEO/CFO) + bearish chart patterns + price breaking below support = consider reducing or exiting position.
Mixed Signals — Proceed with Caution
Good fundamentals but insider selling, or poor fundamentals but strong technicals. These require more research. Check Earnings Calendar — a catalyst may be approaching.
Important Notes
- Stocks only: Nydar's Stock Info widget only works with stock symbols (e.g., AAPL, MSFT), not cryptocurrency pairs.
- Data freshness: Nydar's fundamental data updates quarterly. Nydar's insider data updates within 2 business days of SEC filing.
- Pattern accuracy: Nydar's chart patterns are algorithmically detected and may not always be accurate. Always verify visually on Nydar's chart.
- Not financial advice: Nydar's data is for informational purposes. Always do your own research before trading.
Pro Tips
- Combine Nydar's tabs: Strong fundamentals + insider buying + bullish patterns = high-conviction setup.
- Watch for divergences: Price at resistance but insiders buying? That's interesting.
- Use with other Nydar widgets: Pair with Nydar's Analyst Ratings for Wall Street's view, or Nydar's Signals for technical confirmation.
- Check before earnings: Nydar's insider activity data often picks up before earnings announcements.
How Stock Info Compares to Other Nydar Widgets
| Feature | Stock Info | Earnings Calendar | Analyst Ratings | Institutional Holdings | Market Scanner |
|---|---|---|---|---|---|
| Primary Focus | Company fundamentals | Earnings dates & estimates | Analyst consensus & targets | Fund ownership changes | Multi-filter stock screening |
| Data Depth | 4 tabs, 15+ metrics | EPS estimate, surprise % | Buy/hold/sell, price target | 500+ funds tracked | Customisable filters |
| View Type | Single-stock deep dive | Calendar / list view | Single-stock summary | Single-stock ownership | Multi-stock screening |
| Update Frequency | Quarterly + real-time price | Daily schedule updates | As analysts publish | Quarterly (45-day lag) | Real-time scans |
| Best For | Due diligence research | Catalyst timing | Wall Street sentiment | Smart money tracking | Finding new ideas |
| Pairs Well With | Analyst Ratings | Stock Info | Stock Info | Stock Info | Stock Info |
Related Resources
Further Reading
Last reviewed: March 2026