Trade Journal
Nydar's trade journal records every entry and exit with P&L, risk metrics, and performance analytics
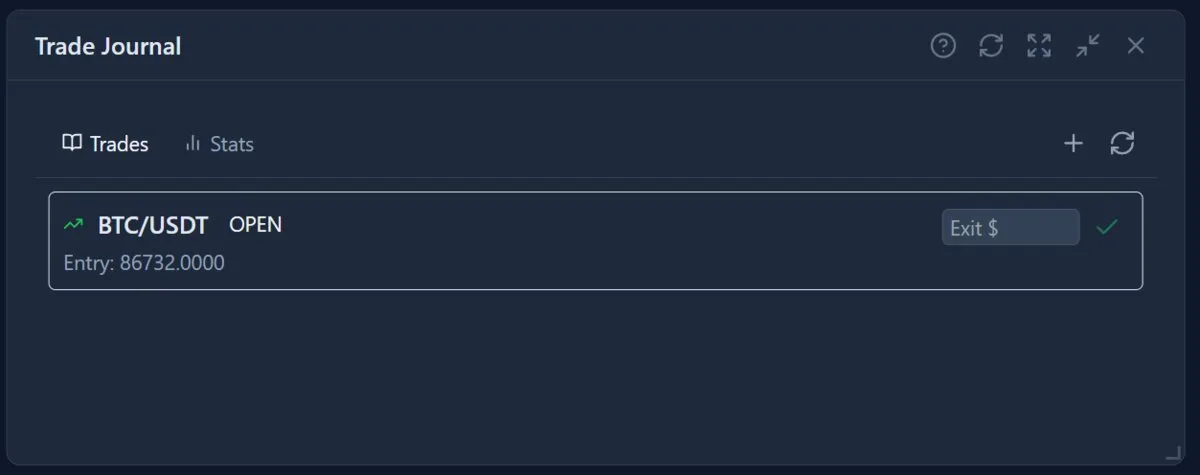
What Is Nydar's Trade Journal Widget?
Nydar's Trade Journal logs every trade with entry/exit prices, P&L, and detailed notes. Nydar tracks win rate, average return, and performance by setup type so you can identify what works. Document your reasoning, emotions, and lessons learned to improve over time.
The evidence for trade journaling is well established. Brett N. Steenbarger's The Psychology of Trading (Wiley, 2003) demonstrated that structured self-review is the single most effective intervention for improving trading performance, with journaling traders showing measurably better risk-adjusted returns within 90 days. Kahneman and Tversky's prospect theory research, published in "Prospect Theory: An Analysis of Decision Under Risk" (Econometrica, 1979, vol. 47, no. 2, pp. 263-291), showed that loss aversion causes traders to hold losers 1.5-2x longer than winners -- a pattern that journaling makes visible and correctable. Andrew W. Lo's Adaptive Markets (Princeton University Press, 2017) further argues that systematic self-observation is how traders evolve their strategies to match changing market regimes.
What to Record in Nydar's Journal
Trade Details
Nydar captures symbol, entry price, exit price, position size, P&L, and date/time automatically.
Setup
Tag the setup in Nydar's journal — what prompted the trade? Which indicators or patterns did you see?
Reasoning
Record in Nydar why you entered, what your thesis was, and why you exited when you did.
Emotions
Nydar's emotion tags let you record how you felt. FOMO? Fear? Overconfident? Emotional awareness helps avoid repeat mistakes.
Lessons
What did you learn? What would you do differently? Did you follow your plan?
Reviewing Your Nydar Journal
Weekly Review
Every week, review all trades in Nydar's journal. Look for patterns: What setups worked? Which didn't? Were losses from bad setups or poor execution?
Monthly Analysis
Monthly, use Nydar's analytics to analyze overall performance. Track metrics over time. Identify your edge and your weaknesses.
Cognitive Biases to Watch For
Nydar's journal helps flag these common biases. Over time, you'll learn which ones affect you most:
Confirmation Bias
Only seeing evidence that supports your trade thesis while ignoring contradicting signals. Journal: "Did I cherry-pick indicators?"
Recency Bias
Overweighting recent events. After 3 winning trades, you feel invincible and size up. After 3 losses, you're paralysed. Journal: "Am I sized based on logic or recent results?"
Loss Aversion
Holding losers too long because realising a loss "feels real." Journal: "Would I enter this trade today at this price?"
Anchoring
Fixating on your entry price instead of current market conditions. Journal: "Am I making decisions based on where price IS or where I WANT it to be?"
Journal Metrics That Matter
Beyond basic P&L, Nydar tracks these metrics across your journaled trades to find your edge:
Win Rate by Setup
Nydar breaks down which setups (breakout, pullback, reversal) perform best. Focus on those.
Average Hold Time
Nydar compares winners vs losers — do you hold losers longer? (Most traders do.)
Time-of-Day Performance
Nydar analyses whether you're better in the morning or afternoon. Some traders perform poorly in specific sessions.
Emotional State Correlation
Do you lose more when angry/tired/excited? Find the pattern and enforce rules around it.
Pro Tips
- Screenshot your charts: Save Nydar's chart views at entry and exit. A picture is worth 1000 words.
- Be honest: Nydar's journal is for you. Don't rationalize bad trades.
- Journal losing trades especially: Losses teach more than wins. Analyze them deeply in Nydar.
- Grade your executions: Even profitable trades can have poor execution. Rate yourself A-F.
- Track emotional state: Nydar's emotion tags help you spot when you're tilted or overconfident. Patterns emerge.
Journal Entry Template
Use this template inside Nydar's journal for consistent entries that are easy to review later:
Learn More
Deepen your understanding with these guides:
Related Widgets
How Trade Journal Compares to Other Nydar Widgets
| Feature | Trade Journal | Portfolio Analytics | Positions | Backtesting | Risk Analytics |
|---|---|---|---|---|---|
| Primary focus | Trade-by-trade review | Aggregate performance | Open trades | Strategy validation | Risk quantification |
| Tracks emotions | Yes (tags + notes) | No | No | No | No |
| Win rate by setup | Yes | Overall only | No | Yes (per strategy) | No |
| Time-of-day analysis | Yes | No | No | No | No |
| Historical data | Full trade history | Equity curve | Current only | Simulated history | Rolling metrics |
| Editable notes | Yes | No | No | No | No |
| Best used for | Self-improvement | Performance tracking | Live risk monitoring | Strategy testing | VaR / drawdown |
Further Reading
Last reviewed: March 2026