The Most Important Lesson
Risk management is more important than finding winning trades. You can have a 70% win rate and still lose money with poor risk management. Protecting your capital ensures you stay in the game long enough to succeed.
The 1% Rule
The golden rule of risk management: never risk more than 1-2% of your total trading capital on a single trade. This means if you have a $10,000 account, your maximum loss on any trade should be $100-200.
Why 1%?
With 1% risk per trade, you can lose 10 trades in a row and still have 90% of your capital. This gives you room to recover and learn. Risk 10% per trade? Just 7 losses wipes out half your account.
Position Sizing
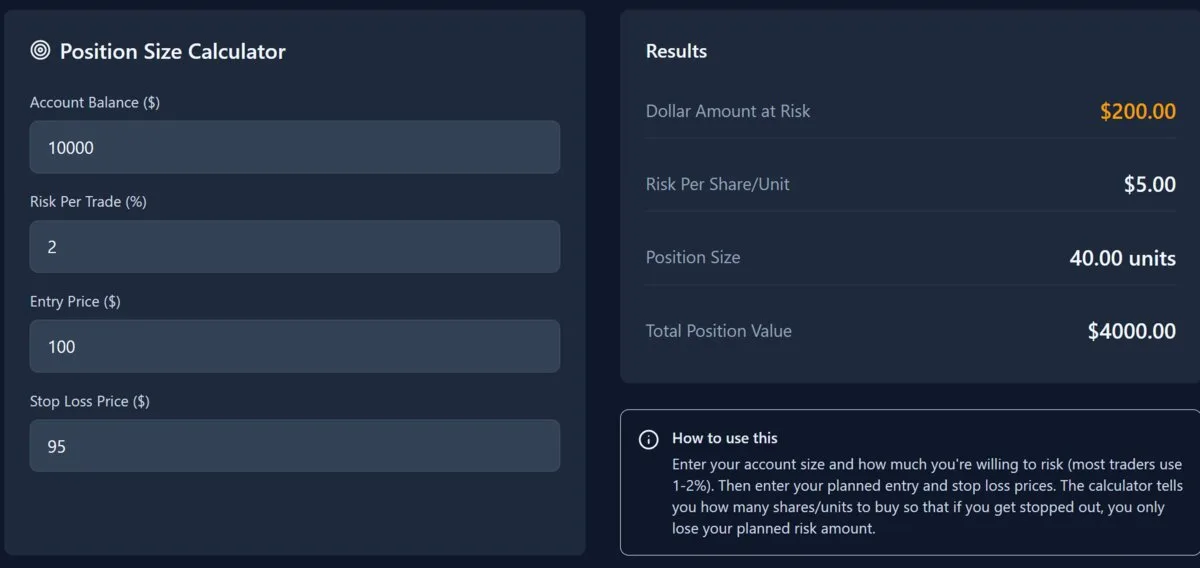
Position sizing determines how much to buy or sell based on your risk tolerance. Here's the formula:
Position Size = Risk Amount ÷ (Entry Price - Stop Loss)
Use Nydar's free Position Size Calculator to do this automatically.
Example: You have $10,000 and want to buy a stock at $50 with a stop loss at $48.
- Risk Amount (1%): $10,000 × 0.01 = $100
- Risk Per Share: $50 - $48 = $2
- Position Size: $100 ÷ $2 = 50 shares
- Total Position Value: 50 × $50 = $2,500
Stop Losses: Your Safety Net
A stop loss is an order to automatically close your position at a predetermined price to limit losses. Key principles:
Risk/Reward Ratio
Before entering a trade, calculate if the potential reward justifies the risk. Aim for at least 1:2 risk/reward ratio - risking $1 to potentially make $2.
1:1
Avoid
1:2
Minimum
1:3+
Ideal
With 1:2 risk/reward, you only need to win 34% of trades to break even. At 1:3, you can be wrong 75% of the time and still profit.
Diversification
Don't put all your eggs in one basket. Spread your capital across:
- Different assets: Don't be 100% in one stock or crypto
- Different sectors: Tech crash won't destroy you if you hold other sectors
- Different strategies: Mix of trend-following, mean-reversion, etc.
- Different timeframes: Some long-term holds, some short-term trades
Correlation Awareness
Holding 5 tech stocks isn't diversification - they tend to move together. Correlation measures how assets move relative to each other. Use the Correlation Matrix widget to check your positions:
- High correlation (+0.7 to +1): Assets move together - same risk
- Low correlation (0): Independent movement - true diversification
- Negative correlation (-0.7 to -1): Move opposite - hedge potential
The Risk Management Checklist
Before every trade, run through this checklist:
Maximum Drawdown Rules
Beyond per-trade risk, professional traders set maximum drawdown limits — the point where they stop trading and reassess:
Stop trading for the day
Reduce size next week
Paper trade until recovered
These aren't arbitrary numbers — they're circuit breakers. Tools like Value at Risk (VaR) and the Sharpe ratio help quantify your exposure. When emotions run high after losses, rules protect you from yourself. The Risk Analytics widget tracks your drawdown in real time so you can enforce these limits.
The Maths of Recovery
Understanding why protecting capital matters more than maximising gains:
-10% loss
Needs +11% to recover
-25% loss
Needs +33% to recover
-50% loss
Needs +100% to recover
-75% loss
Needs +300% to recover
This asymmetry is why the 1% rule exists. A 10-trade losing streak at 1% per trade puts you down ~10%, requiring only 11% to recover. The same streak at 5% per trade? Down ~40%, needing +67% to recover. That's the difference between a setback and a disaster.
Common Mistakes to Avoid
Moving Stop Losses Further Away
When a trade goes against you, accept the loss. Moving stops turns small losses into big ones.
Averaging Down on Losers
Adding to losing positions increases risk. If your analysis was wrong, exit - don't double down.
Revenge Trading
After a loss, taking bigger trades to "win it back" leads to bigger losses. Stick to your system.
Ignoring Correlation
5 different crypto positions isn't diversified - they all tank together in a crypto crash.
Further Reading
- Investopedia: Risk Management in trading — Position sizing, stop losses, and drawdown control
- FCA: Understanding financial risk — UK financial regulator consumer guidance
Written by Ryan Clinton
Founder of Nydar. Software engineer with experience at Cowen Inc (Wall Street) and on large-scale infrastructure projects. Built Nydar to make professional trading tools accessible to everyone.
Last reviewed: March 2026