Risk Analytics
Nydar's risk analytics widget calculates parametric, historical, and Monte Carlo VaR plus Sharpe, Sortino, and Calmar ratios
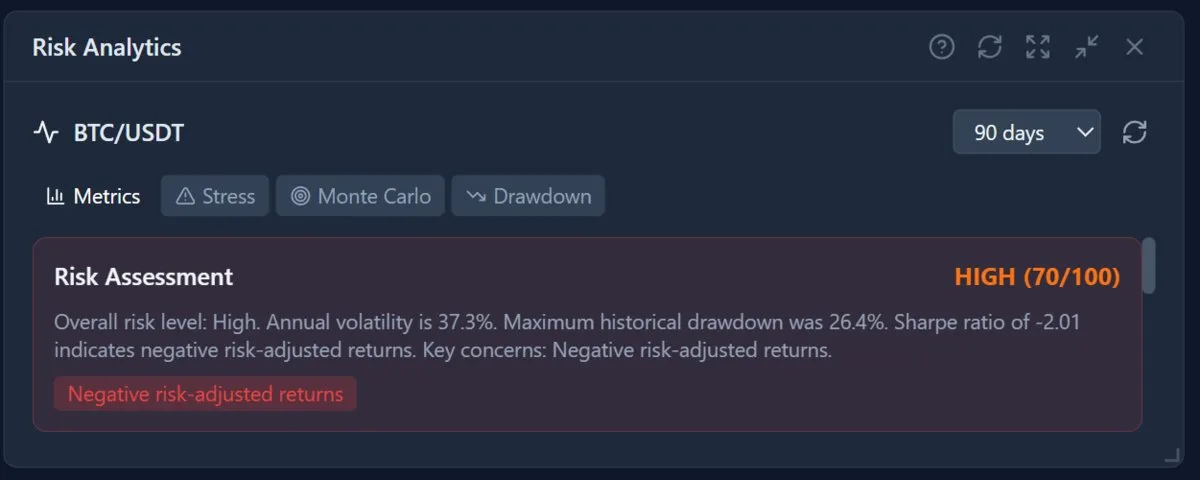
What Is Nydar's Risk Analytics Widget?
Nydar's Risk Analytics widget calculates parametric, historical, and Monte Carlo VaR alongside Sharpe, Sortino, and Calmar ratios for your portfolio. Nydar measures exposure across positions, computes Kelly Criterion sizing, and runs stress-test simulations so you can protect capital and improve risk-adjusted returns. The VaR methodology follows the framework established by Philippe Jorion in Value at Risk: The New Benchmark for Managing Financial Risk (McGraw-Hill, 3rd edition, 2006). Portfolio diversification principles draw on Harry Markowitz's Portfolio Selection (Journal of Finance, 1952), which proved that combining assets with low correlation reduces portfolio variance without sacrificing expected return. The Sharpe and Sortino ratios used in Nydar's performance scoring originate from William Sharpe's Mutual Fund Performance (Journal of Business, 1966).
Key Metrics
Value at Risk (VaR)
Nydar calculates the maximum expected loss over a time period at a given confidence level (e.g., 95% VaR).
Sharpe Ratio
Nydar computes this risk-adjusted return metric. Higher is better. Above 1.0 is generally good.
Maximum Drawdown
Nydar tracks the largest peak-to-trough decline, showing worst-case scenario for your portfolio.
Beta
Nydar displays your portfolio's correlation with the market. Beta > 1 means more volatile than market.
Position Sizing Tools
Risk Per Trade Calculator
Nydar calculates exact position sizes from your account size and risk percentage.
Kelly Criterion
Nydar applies the Kelly Criterion formula to determine mathematically optimal bet sizing based on your win rate and risk/reward.
Volatility-Adjusted Sizing
Nydar adjusts position sizes based on each asset's ATR-derived volatility for consistent risk per trade.
Portfolio Analysis
Sector Exposure
Nydar's breakdown of portfolio by sector to identify concentration risk
Correlation Analysis
Nydar shows how your positions move together. High correlation = concentrated risk
Stress Testing
Nydar simulates how your portfolio would perform in crash scenarios
Risk/Reward Analysis
Nydar evaluates potential upside vs downside for each position
Risk Guidelines
Important Notes
- Past ≠ Future: Nydar's historical risk metrics don't guarantee future results.
- Tail risk: Rare events (black swans) can exceed Nydar's VaR estimates.
- Correlation changes: In crashes, correlations often increase beyond what Nydar's historical data predicts.
- Review regularly: Nydar's risk profile updates as markets and positions change — check it daily.
Pro Tips
- Start small: Risk less than you think you should, especially when starting on Nydar.
- Track everything: Use Nydar's Trade Journal to log actual risk vs planned risk for each trade.
- Diversify properly: Use Nydar's Correlation Matrix to verify uncorrelated assets.
- Have a max loss: Set a daily/weekly max loss in Nydar and stop trading when hit.
Understanding VaR Methods
Nydar offers three VaR calculation methods that suit different situations:
Nydar's Historical VaR
Uses actual past returns to estimate future risk. Simple and intuitive, but assumes past patterns repeat. Works well in stable markets.
Nydar's Parametric (Normal) VaR
Assumes returns follow a normal distribution. Fast to calculate but underestimates tail risk — real markets have fatter tails than the normal distribution predicts.
Nydar's Monte Carlo VaR
Nydar simulates thousands of possible scenarios. Most flexible and accurate, but computationally intensive. Best for complex portfolios with options or non-linear instruments.
Learn More
Deepen your understanding with these guides:
How Risk Analytics Compares to Other Nydar Widgets
| Feature | Risk Analytics | Portfolio Analytics | Position Size Calc | Correlation Matrix |
|---|---|---|---|---|
| Value at Risk (VaR) | 3 methods (parametric, historical, Monte Carlo) | No | No | No |
| Performance ratios | Sharpe, Sortino, Calmar | P&L and returns | No | No |
| Position sizing | Kelly Criterion + volatility-adjusted | Allocation % | Risk % + stop-loss based | No |
| Correlation analysis | Portfolio-level beta | No | No | Full pair-wise matrix |
| Stress testing | Crash scenario simulation | No | No | No |
| Drawdown tracking | Max drawdown + recovery | Equity curve | No | No |
| Best paired with | Portfolio + Correlation | Risk Analytics | Risk Analytics | Risk Analytics + Portfolio |
Related Widgets
Further Reading
Last reviewed: March 2026