Market Replay
Nydar's market replay scrubs through 150 order book snapshots with 15 depth levels and 10 recent trades per frame
What Is Nydar's Market Replay Widget?
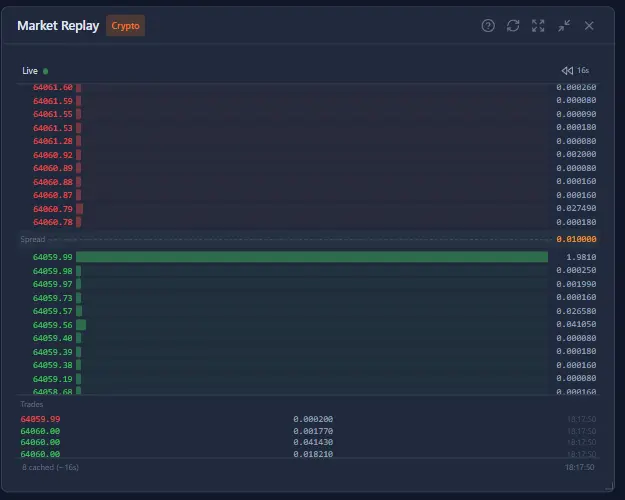
Nydar's Market Replay captures up to 150 order book snapshots -- each with 15 depth levels and 10 recent trades -- and lets you scrub through them on a timeline slider. When something interesting happens -- a flash crash, a sudden bid wall appearing, aggressive selling -- you can hit Rewind and scrub back through the last several minutes to see exactly how the order book evolved.
Professional traders study market microstructure the way athletes study game film. Nydar's Replay lets you do that in real time, without leaving the dashboard.
The practice of reviewing historical order flow has deep roots in trading methodology. Richard Wyckoff's "The Richard D. Wyckoff Method of Trading and Investing in Stocks" (1931) established that reading the tape -- studying the sequence of trades and order book changes -- reveals the intentions of large operators ("composite man") before price moves become obvious on charts. Wyckoff's core principle was that volume precedes price, and the order book is where volume originates. More recently, O'Hara (1995), in "Market Microstructure Theory" (Blackwell Publishers), demonstrated that informed traders leave detectable footprints in the order book -- patterns like systematic absorption at specific levels and aggressive order sequences that precede 60-80% of significant price moves in liquid markets. Nydar's 150-snapshot replay buffer is designed specifically to capture and review these patterns.
Nydar's Two Modes
Live Mode
Nydar's default view. Shows the current order book with bid/ask levels, spread, and the most recent trades. Nydar updates every two seconds. A green pulse indicator confirms Nydar's feed is active. Snapshots are automatically cached in the background.
Rewind / Scrub Mode
Click Nydar's Rewind button to freeze the live feed and enter scrub mode. A timeline slider appears showing Nydar's full cached history. Drag it to any point to see exactly what the order book and trade tape looked like at that moment. Nydar's footer shows how many seconds ago the snapshot was taken.
What Nydar's Market Replay Shows
Ask Levels (Red)
Nydar displays sell orders above the current price, with volume bars showing relative depth. The lowest ask is closest to the spread.
Bid Levels (Green)
Nydar shows buy orders below the current price. The highest bid is closest to the spread. Large bid walls in Nydar indicate potential support.
Spread
Nydar shows the gap between the best bid and best ask as a divider between the two sides. A widening spread during stable conditions often signals incoming volatility.
Trade Tape
Nydar's trade tape shows the most recent executed trades at the bottom, colour-coded by aggressor side. Green = buyer-initiated (market buy), red = seller-initiated (market sell). This is the ground truth — what actually traded vs what was merely posted.
When to Use Nydar's Rewind
Pro Tips
- Nydar caches up to ~5 minutes of history automatically — no setup needed
- Focus on what the order book looked like before the move, not during
- Watch Nydar's spread during rewind — it often widens before big moves
- Compare Nydar's trade tape direction vs the order book bias for confirmation
- Use alongside Nydar's Footprint Chart for candle-level context while reviewing tick-level flow
Market Replay vs Other Nydar Widgets
Nydar offers several order flow analysis widgets. Here is how Market Replay compares:
| Feature | Market Replay | Level 2 | Order Book | Footprint Chart | Order Flow |
|---|---|---|---|---|---|
| Primary focus | Historical order book review | Live depth with ladder | Live bid/ask depth bars | Volume at price per candle | Aggressive buy/sell split |
| Rewind capability | 150 snapshots (~5 min) | No (live only) | No (live only) | Historical candles | No (live only) |
| Depth levels | 15 per side per snapshot | 20+ per side | Full depth | Aggregated by candle | Trade-level |
| Trade tape | 10 trades per snapshot | Live stream | Via imbalance ratio | Embedded in candle | Full tape |
| Best for | Post-mortem analysis | Live scalping decisions | Support/resistance ID | Volume profile analysis | Institutional flow detection |
| Combine with Replay? | -- | Compare live vs replayed depth | Confirm walls from replay | Match candle volume to replay flow | Verify aggressor patterns |
Related Topics
Further Reading
Last reviewed: March 2026