Volume Profile
Nydar's volume profile widget analyses volume distribution at each price level to identify value areas and point of control
What Is Nydar's Volume Profile Widget?
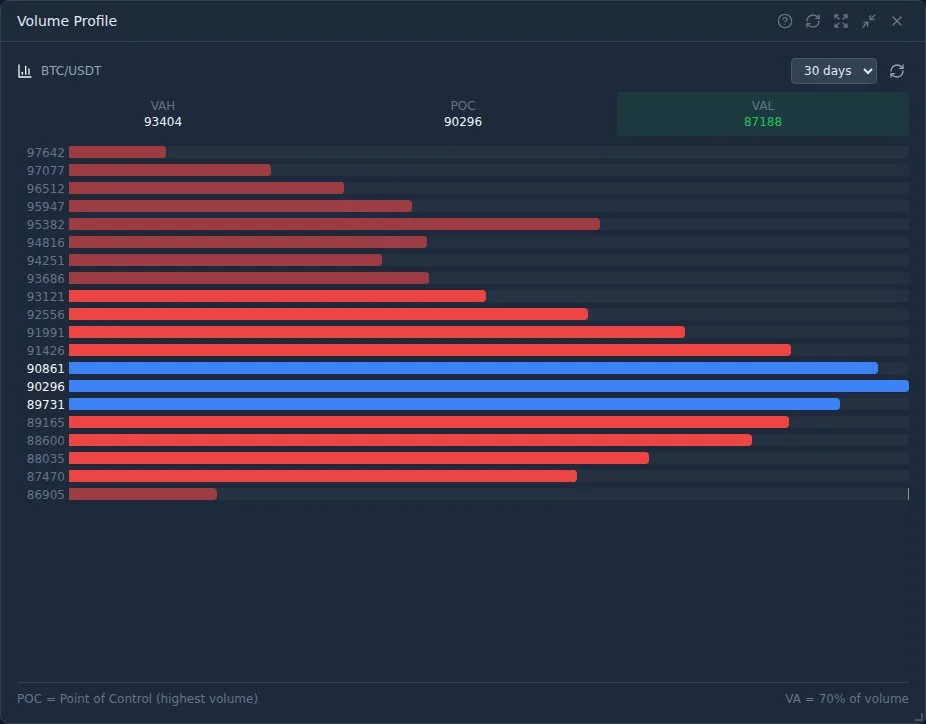
Nydar's Volume Profile widget displays trading volume at each price level as a horizontal histogram, covering the full visible range. Unlike standard volume bars that show volume per time period, Nydar's volume profile shows WHERE trading activity occurred — broken into buy-side and sell-side components.
High volume areas often act as support/resistance because they represent prices where many traders have positions. Nydar automatically calculates the Point of Control (POC), Value Area High (VAH), and Value Area Low (VAL) for every profile — Nydar refreshes these levels every 30 seconds on live data.
The theoretical basis for volume-at-price analysis was established by J. Peter Steidlmayer, who developed Market Profile at the Chicago Board of Trade in the 1980s. Dalton, Jones, and Dalton formalized these concepts in Mind Over Markets (1990, Probus Publishing), demonstrating that volume distribution across price levels follows a bell curve during balanced markets, with the POC at the centre. More recently, Kavajecz and Odders-White (2004), "Technical Analysis and Liquidity Provision," The Review of Financial Studies, 17(4), 1043-1071, showed that volume-at-price levels predict future support and resistance with statistical significance.
Key Concepts in Nydar's Volume Profile
Nydar marks the price level with the highest traded volume as the POC. This is the "fair value" where most trading occurred. Price often gravitates back to the POC.
Nydar shades the range containing 70% of the total volume. Represented by VAH (Value Area High) and VAL (Value Area Low). Trading within the value area is "fair"; outside it is considered "unfair."
Reading Nydar's Volume Profile Widget
- Blue bars - Nydar highlights prices near the POC (highest volume)
- Green bars - Nydar marks prices below current price (potential support)
- Red bars - Nydar marks prices above current price (potential resistance)
- •Longer bars = more volume = stronger level. Nydar segments volume into 50 price bins across the visible range
Trading Tips
- Nydar's POC line shows where price often returns after moving away
- Low volume areas (thin bars) in Nydar's profile offer little resistance - price moves through quickly
- High volume areas (thick bars) in Nydar's profile tend to attract price and act as magnets
- Breaks above Nydar's VAH or below Nydar's VAL often signal trend continuation
- Combine with Nydar's Order Flow or Nydar's Volume Delta widget — volume profile alone isn't a complete strategy
Nydar Volume Profile Trading Strategies
Value Area Fade
When price pushes above Nydar's VAH or below Nydar's VAL but fails to hold, fade the move back into the value area. The idea is that "unfair" prices tend to revert to fair value. Place your stop just beyond the extreme.
POC Magnet
When price moves away from Nydar's POC on low volume, expect it to return. Nydar's POC acts as a magnet because it represents the price most accepted by the market. Trade pullbacks toward the POC during ranging markets.
Low Volume Node Breakout
Nydar's thin bars reveal low volume areas that offer little resistance. When price enters a low volume node, it typically moves through quickly. Target the next high volume node in Nydar's profile as your take profit level.
Volume Profile vs Other Nydar Widgets
| Feature | Volume Profile | Footprint Chart | Volume Delta | Price Chart | Level 2 |
|---|---|---|---|---|---|
| Shows volume at price | Yes (aggregate) | Yes (per candle) | No | No | No |
| Identifies S/R levels | POC, VAH, VAL | Imbalance zones | Via divergence | Swing points | Order clusters |
| Buy/sell breakdown | Yes | Yes | Yes | No | Yes (bid/ask) |
| Time dimension | Session/range | Per candle | Cumulative | OHLCV per bar | Current snapshot |
| Best timeframe | Daily/session | 5m-1H | 1H+ | All | Scalping |
| Pairs well with | Chart, Footprint | Volume Profile | Order Flow, Chart | Volume Profile, SMC | Order Flow |
Learn More
Deepen your understanding of Nydar's volume tools with these guides:
Related Topics
Further Reading
Last reviewed: March 2026