ML Prediction
Nydar's ML prediction widget uses XGBoost models that extract 100+ features and select the top 15 by importance to generate directional forecasts with confidence scores
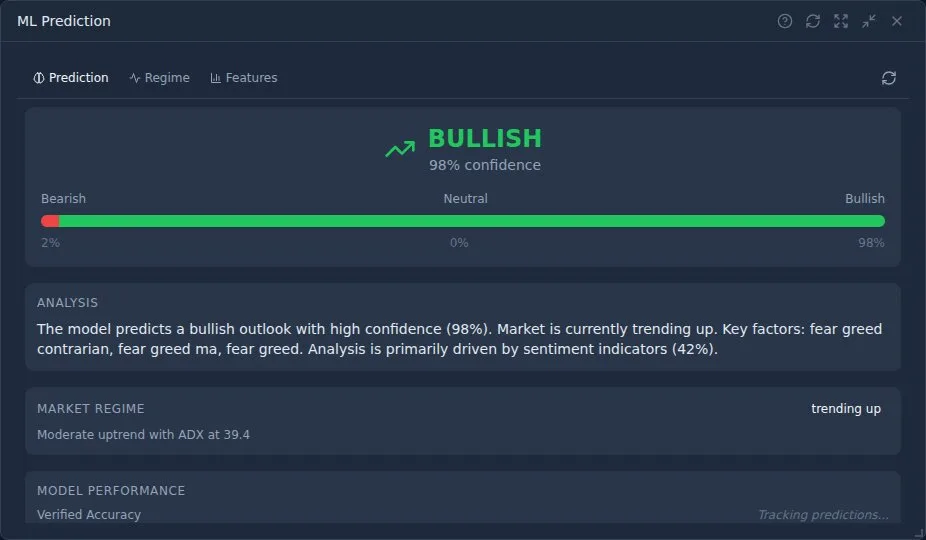
What Is Nydar's ML Prediction Widget?
Nydar's ML Prediction widget uses XGBoost models that extract 100+ features and select the top 15 by predictive importance to forecast short-term price direction. Each prediction includes a bullish or bearish call, a confidence score from 0-100%, and the key indicators driving the forecast. Predictions update every 60 seconds with fresh market data. The gradient boosting framework is detailed in Tianqi Chen and Carlos Guestrin's XGBoost: A Scalable Tree Boosting System (Proceedings of KDD, 2016), which demonstrated how regularised gradient boosting achieves state-of-the-art performance on structured data, and Marcos Lopez de Prado's Advances in Financial Machine Learning (Wiley, 2018), which covers feature importance, cross-validation pitfalls, and bet sizing for ML-driven trading strategies.
See the AI signals feature page for a full overview of Nydar's machine learning capabilities, or read the AI trading signals guide for the technical details.
How Does Nydar's ML Model Generate Predictions?
Nydar's model extracts 100+ features — including RSI, MACD, Bollinger Bands, moving averages, volume ratios, macro-economic indicators, and momentum oscillators — then selects the top 15 by importance and feeds them into an XGBoost gradient boosting classifier. Nydar outputs the probability of upward versus downward movement in the next period, displayed as a direction and confidence percentage, refreshing every 60 seconds.
Input Features
Nydar's model analyzes: RSI, MACD, moving averages, Bollinger Bands, volume, price momentum, volatility, and other technical indicators.
XGBoost Model
Nydar uses gradient boosting to find patterns in the features that historically preceded price movements.
Output
Nydar outputs the probability of upward vs downward movement in the next period, displayed as direction and confidence percentage.
What Do Nydar's Confidence Scores Mean?
Nydar's confidence scores reflect how strongly the model's features align with the predicted direction. A score of 50-60% means weak agreement with low conviction. Scores of 70-80% indicate strong indicator alignment and are more actionable. Scores above 80% are rare and represent Nydar's highest-conviction predictions.
Bullish Prediction
Nydar's model predicts price is more likely to increase. Higher confidence = stronger signal.
Bearish Prediction
Nydar's model predicts price is more likely to decrease. Higher confidence = stronger signal.
Confidence Score
50-60%: Weak signal, low confidence
60-70%: Moderate signal
70-80%: Strong signal
80%+: Very strong signal (rare)
Which Indicators Drive Nydar's Predictions?
Nydar's XGBoost model extracts 100+ features and selects the top 15, with momentum indicators like RSI and MACD typically ranking highest in feature importance. Volatility measures (ATR, Bollinger Band width) and moving average relationships follow. Understanding which features drive a prediction helps you judge whether it aligns with current conditions.
Momentum Indicators
High ImportanceRSI, MACD, and rate of change are typically the strongest predictors. Nydar's model detects momentum shifts before they become visually obvious.
Volatility Measures
Medium-HighBollinger Band width, ATR, and standard deviation help Nydar's model distinguish between trending and ranging conditions.
Moving Averages
MediumPrice relative to 20/50/200 MAs, plus MA crossover states, provide trend context for the prediction.
Volume
ModerateRelative volume, OBV trend, and volume-price divergences help confirm whether moves have conviction.
When Should I Trust or Ignore Nydar's Prediction?
Trust Nydar's predictions more when confidence is above 70%, the prediction aligns with the broader trend, and no major news events are pending. Discount or ignore Nydar's predictions below 60% confidence, during earnings announcements, in extreme market conditions, or when they contradict strong technical levels.
Trust More When
- • Confidence is 70%+ (stronger signal)
- • Prediction aligns with the broader trend
- • No major news events pending
- • Volume is normal or above average
- • Multiple timeframes agree
Ignore or Discount When
- • Confidence is below 60%
- • Major earnings or Fed announcements pending
- • Market is in extreme fear/greed conditions
- • Low volume (e.g., holidays, after-hours)
- • Prediction contradicts strong technical levels
Critical Warnings
- No prediction is guaranteed: Nydar's ML models can and do get it wrong. Never trade blindly based on predictions.
- Past performance ≠ future results: Nydar's model is trained on historical data. Markets change.
- Black swan events: Nydar's models cannot predict news, hacks, regulations, or other unexpected events.
- Use as one input: Combine Nydar's predictions with your own analysis. ML is a tool, not a crystal ball.
Pro Tips
- High confidence + technical confluence: Best setups are when Nydar's ML prediction aligns with chart patterns and Nydar's indicator signals.
- Avoid trading weak signals: 55% confidence is barely better than a coin flip. Wait for Nydar's stronger signals.
- Track accuracy: Note Nydar's prediction outcomes in your journal to assess real-world model performance.
- Timeframe matters: Nydar's predictions are for the selected timeframe. A bullish 1h prediction says nothing about the daily trend.
How ML Prediction Compares to Other Nydar Widgets
| Feature | ML Prediction | Signals & Levels | Daily Picks | Indicators | Backtester |
|---|---|---|---|---|---|
| Approach | XGBoost ML model | Rule-based convergence | Multi-factor ranking | Raw values | Historical simulation |
| Features analysed | 100+ (top 15 selected) | 13 patterns + 5 EMA pairs | Multi-indicator score | 105 indicators | Strategy-dependent |
| Confidence score | 0-100% probability | Weak / Moderate / Strong | Ranked list | No | Win rate % |
| Update frequency | Every 60 seconds | Per candle close | Daily | Real-time | On-demand |
| Explainability | Feature importance shown | Signal type shown | Score breakdown | Full values visible | Trade-by-trade log |
| Best paired with | Signals + Indicators | Prediction + Chart | Signals + Prediction | Signals + Prediction | Prediction + Signals |
Related Widgets
Further Reading
Last reviewed: March 2026