Technical Indicators
Nydar includes 105 technical indicators — RSI, MACD, Bollinger Bands, Ichimoku, and more across momentum, trend, volatility, and volume
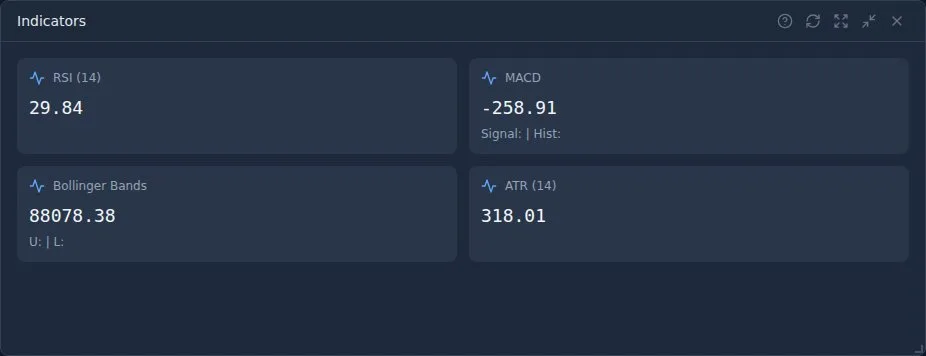
What Is Nydar's Technical Indicators Widget?
Nydar's Technical Indicators widget calculates and displays 105 technical analysis indicators across 4 categories — trend, momentum, volatility, and volume — for the selected symbol. These mathematical calculations help identify trends, momentum shifts, volatility regimes, and potential reversal points.
Powered by the pandas-ta library, Nydar's indicator engine provides the same professional-grade indicators used by institutional traders worldwide, with real-time recalculation as new price data arrives. Several of the core momentum indicators originate from J. Welles Wilder's New Concepts in Technical Trading Systems(Trend Research, 1978), which introduced the RSI, ATR, ADX, and Parabolic SAR — all available in Nydar's 105-indicator library. The volatility indicators include Bollinger Bands as defined in John Bollinger's Bollinger on Bollinger Bands(McGraw-Hill, 2001), which established the 20-period SMA with 2 standard deviations as the default configuration still used by most platforms today.
Nydar's Indicator Features
105 Indicators
Nydar provides 105 indicators across trend, momentum, volatility, and volume categories.
Real-Time Updates
Nydar's indicators recalculate automatically as new price data arrives via WebSocket.
Multiple Timeframes
Nydar lets you change timeframe in the header to see indicator values for different periods.
Clear Display
Nydar displays key indicators prominently with colour-coded bullish/bearish readings.
Nydar's Key Indicators Explained
RSI (Relative Strength Index)
Nydar calculates RSI momentum on a scale of 0-100, showing whether an asset is overbought or oversold.
Overbought (70+)
May be due for pullback. Consider taking profits or waiting to buy.
Neutral (30-70)
Normal range. Look for other signals.
Oversold (30-)
May be due for bounce. Potential buying opportunity.
Tip: RSI works best in ranging markets. In strong trends, RSI can stay overbought/oversold for extended periods.
MACD (Moving Average Convergence Divergence)
Nydar's MACD is a trend-following momentum indicator showing the relationship between two moving averages.
MACD Line: 12-period EMA minus 26-period EMA
Signal Line: 9-period EMA of MACD Line
Histogram: Difference between MACD and Signal lines
Bullish Signal: MACD crosses above Signal line
Bearish Signal: MACD crosses below Signal line
Moving Averages (SMA/EMA)
Nydar computes smoothed price data to identify trend direction. EMA reacts faster than SMA.
20 MA: Short-term trend. Good for active trading.
50 MA: Medium-term trend. Popular for swing trading.
200 MA: Long-term trend. Institutional benchmark.
Price above MA = bullish. Price below MA = bearish. MA crossovers signal trend changes.
Bollinger Bands
Nydar's Bollinger Bands show volatility by plotting upper and lower bands around a moving average.
Upper Band: 20 SMA + (2 x Standard Deviation)
Middle Band: 20-period SMA
Lower Band: 20 SMA - (2 x Standard Deviation)
Bands expand during volatility, contract during quiet periods. Price tends to stay within bands 95% of the time.
ATR (Average True Range)
Nydar's ATR measures volatility by calculating average price range over a period.
High ATR: High volatility, larger price swings. Use wider stops.
Low ATR: Low volatility, smaller moves. Use tighter stops.
Common to set stop loss at 1.5x-2x ATR from entry price.
Stochastic Oscillator
Nydar's Stochastic compares closing price to the price range over a period. Scale 0-100.
Overbought (80+): May reverse down
Oversold (20-): May reverse up
%K and %D crossovers provide buy/sell signals. Works well in ranging markets.
Using Nydar's Indicators Effectively
Don't Use Too Many
Analysis paralysis is real. Pick 2-3 of Nydar's indicators that complement each other: one trend indicator (MA), one momentum indicator (RSI), and one volatility indicator (ATR or Bollinger). More isn't better.
Understand What You're Using
Learn how each of Nydar's indicators is calculated and what it actually measures. Using indicators you don't understand leads to poor decisions.
Look for Confluence
Multiple Nydar indicators agreeing strengthens a signal. RSI oversold + MACD bullish crossover + price at support = strong confluence in Nydar's indicator panel.
Context Matters
Nydar's indicators behave differently in trending vs ranging markets. RSI overbought in a strong uptrend can stay overbought for weeks. Adapt your interpretation to market conditions.
Nydar's Indicator Categories
Trend Indicators
Nydar's trend indicators identify direction:
SMA, EMA, DEMA, TEMA, ADX, Ichimoku, Parabolic SAR
Momentum Indicators
Nydar's momentum indicators measure speed of price change:
RSI, MACD, Stochastic, CCI, Williams %R, ROC
Volatility Indicators
Nydar's volatility indicators measure price fluctuation:
ATR, Bollinger Bands, Keltner Channels, Standard Deviation
Volume Indicators
Nydar's volume indicators analyse trading volume:
OBV, VWAP, MFI, Chaikin Money Flow, Volume Profile
Choosing the Right Nydar Indicators
With 105 indicators available in Nydar, choosing the right ones is crucial. The key is to select Nydar indicators from different categories so they provide independent information rather than confirming the same thing.
Nydar's Indicator Selection Framework
Step 1: Define Your Trading Style
Day traders need fast, responsive indicators (short EMAs, RSI 7-14). Swing traders need balanced indicators (MACD, RSI 14, 50 SMA). Position traders need slow, smooth indicators (200 SMA, weekly RSI).
Step 2: Pick One from Each Category
Choose one trend indicator, one momentum indicator, and one volatility indicator. This gives you three independent data points. Adding more from the same category is redundant.
Step 3: Add Volume (Optional)
A volume indicator like OBV or VWAP adds a 4th dimension. Volume confirms whether price moves have conviction behind them.
Step 4: Test and Simplify
If two indicators always give the same signal, drop one. Your ideal setup should be 2-4 indicators that frequently disagree — their agreement is what makes a strong signal.
Common Mistake: Redundant Indicators
Using RSI, Stochastic, and CCI together is redundant — they're all momentum oscillators measuring similar things. You'll get the same signal three times and think it's "triple confirmation" when it's really just one data point expressed three ways. Pick one momentum oscillator and pair it with a different category.
Nydar's Proven Indicator Combinations
These are battle-tested combinations available in Nydar's indicator library. Each provides independent signals that strengthen when they agree.
The Trend Trader (Trend + Momentum)
50 EMA + RSI 14 + ATR
Use the 50 EMA for trend direction. RSI confirms momentum (look for oversold in uptrend for buy signals). ATR sizes your stop loss.
Signal: Price above 50 EMA + RSI bouncing from 30-40 zone + bullish candle = buy.
The Momentum Trader (Multiple Momentum)
MACD + Stochastic + VWAP
MACD shows trend momentum. Stochastic shows overbought/oversold. VWAP provides a daily bias (above = bullish, below = bearish).
Signal: MACD bullish crossover + Stochastic exiting oversold + price above VWAP = strong buy.
The Volatility Trader (Volatility + Momentum)
Bollinger Bands + RSI + OBV
Bollinger Bands show volatility extremes. RSI confirms momentum direction. OBV confirms whether volume supports the move.
Signal: Price at lower Bollinger Band + RSI oversold + OBV making higher lows = bounce trade.
The Scalper (Fast Signals)
9 EMA / 21 EMA Crossover + RSI 7 + VWAP
Fast EMA crossover for entries. Short-period RSI for quick overbought/oversold readings. VWAP for intraday directional bias.
Signal: 9 EMA crosses above 21 EMA + RSI 7 above 50 + price above VWAP = scalp long.
When to Use Each Nydar Indicator Category
Trend Indicators — In Trending Markets
MAs, ADX, Ichimoku, Parabolic SAR excel when price is making higher highs/lows or lower highs/lows. They tell you the trend direction and when to stay in.
Skip when: Market is choppy with no clear direction (ADX below 20).
Momentum Indicators — At Turning Points
RSI, MACD, Stochastic, CCI are best for identifying when a trend is losing steam or when a reversal is forming. Divergence between price and momentum is particularly powerful.
Skip when: In a strong, established trend (momentum oscillators will stay "overbought" for weeks).
Volatility Indicators — For Position Sizing
ATR, Bollinger Bands, Keltner Channels help you adapt to changing volatility. High volatility = wider stops, smaller positions. Low volatility = tighter stops, larger positions.
Always useful: Volatility indicators work in any market condition.
Volume Indicators — For Confirmation
OBV, VWAP, MFI, Chaikin Money Flow tell you whether moves are backed by real participation. A breakout on low volume is suspicious; a breakout on high volume is credible.
Essential for: Breakout trading, trend confirmation, divergence analysis.
Nydar Pro Tips
- RSI Divergence: When price makes a new high but Nydar's RSI doesn't, it's bearish divergence - potential reversal. Vice versa for bullish divergence.
- MACD Histogram: Nydar's shrinking histogram often precedes a MACD crossover. It's an early warning signal.
- 200 MA Rule: Many traders only take longs above Nydar's 200 MA and shorts below it. Simple but effective filter.
- Bollinger Band Squeeze: When Nydar's bands contract significantly, a big move often follows. Watch for the direction of the breakout.
- Indicator Lagging: Remember that most of Nydar's indicators are lagging - they confirm what already happened. Use them for confirmation, not prediction.
Related Nydar Widgets
How Technical Indicators Compares to Other Nydar Widgets
| Feature | Technical Indicators | Custom Indicators | Advanced Chart | Scanner | Signals & Levels |
|---|---|---|---|---|---|
| Number of indicators | 105 pre-built | 29 functions (build your own) | Overlay on price | Filter-based subset | Key signals only |
| Indicator categories | Trend, momentum, volatility, volume | Same 4 categories | Visual overlays | Screening criteria | Buy/sell/hold |
| Real-time updates | Yes | Yes | Yes | Yes | Yes |
| Custom formulas | No (pre-built only) | Yes (code editor) | No | No | No |
| Multi-timeframe | Yes (via header) | Yes | Yes | No | MTF alignment |
| Colour-coded signals | Bullish/bearish colouring | Single line | Candlestick colours | Pass/fail | Buy/sell/hold |
| Best for | Quick indicator checks | Building unique signals | Visual price analysis | Finding opportunities | Trade timing |
Further Reading
Last reviewed: March 2026