What Are Support and Resistance?
Support and resistance are price levels where buying or selling pressure is strong enough to stop or reverse price movement. They're like floors and ceilings for price.
Support (Floor)
A price level where buying pressure overcomes selling pressure. Price tends to bounce UP from support.
Think of it as: "Buyers step in at this price because they think it's a good deal"
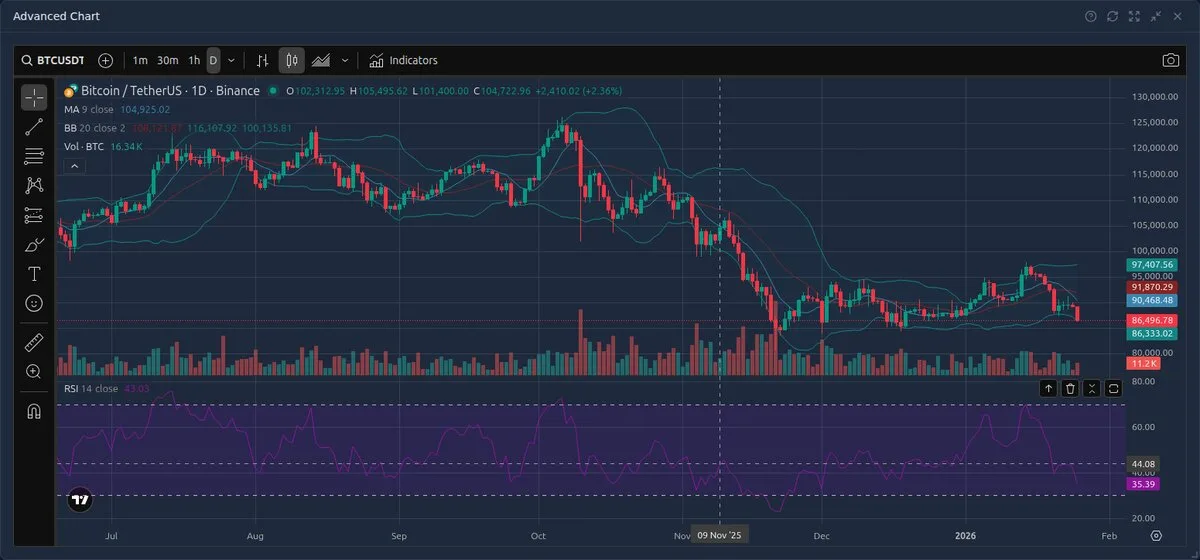
Resistance (Ceiling)
A price level where selling pressure overcomes buying pressure. Price tends to bounce DOWN from resistance.
Think of it as: "Sellers take profits at this price because they think it's expensive"
How Price Reacts
Price bounces between support and resistance until one level breaks
Why Support & Resistance Works
S&R levels work because of market memory. Traders remember where price reversed before and expect it to happen again.
The Psychology Behind It
At Support:
Buyers who missed the last bounce want another chance. Sellers who shorted are taking profits. Result: buying pressure.
At Resistance:
Buyers who bought lower are taking profits. Sellers see a good shorting opportunity. Result: selling pressure.
How to Identify S&R Levels
1. Previous Highs and Lows
The most basic method. Look for places where price has reversed before.
- • Swing highs become resistance
- • Swing lows become support
- • The more times price has tested a level, the stronger it is
2. Round Numbers (Psychological Levels)
Humans like round numbers. Price often reacts at $50, $100, $1000, etc.
- • BTC at $60,000, $70,000, $100,000
- • SPY at $400, $450, $500
- • EUR/USD at 1.1000, 1.0500
3. Moving Averages as Dynamic S&R
Moving averages act as moving support/resistance levels.
- • 20 EMA: Short-term dynamic S&R
- • 50 EMA: Medium-term, widely watched
- • 200 SMA: Major level, institutional focus
4. Trendlines
Diagonal support and resistance. Connect swing lows (uptrend) or swing highs (downtrend).
Uptrend Support Line
Downtrend Resistance Line
5. High Volume Areas
Levels where lots of trading occurred often become S&R. Nydar's volume profile widget shows these areas visually. Heavy volume = lots of positions = strong level.
6. VWAP (Volume Weighted Average Price)
VWAP represents the average price weighted by volume throughout the day. Institutional traders benchmark their execution against VWAP, making it a powerful dynamic S&R level.
- • Price above VWAP: Buyers in control — VWAP acts as support
- • Price below VWAP: Sellers in control — VWAP acts as resistance
- • Price crossing VWAP: Potential trend shift for the session
- • Resets daily: VWAP starts fresh each session, unlike moving averages
Day traders often use VWAP as their primary reference for intraday bias. If price is above VWAP, they look for long entries on pullbacks to VWAP.
7. Pivot Points
Pivot points are mathematically calculated S&R levels based on the previous day's (or week's) high, low, and close. Popular with institutional and floor traders because every participant calculates the same levels.
Standard Pivot: (High + Low + Close) / 3
Resistance 1: (2 x Pivot) - Low
Support 1: (2 x Pivot) - High
R2/S2: Extend further using the range (High - Low)
Key advantage: everyone sees the same levels. If price opens above the pivot, the bias is bullish. Below the pivot, bearish.
8. Fibonacci Levels
Fibonacci retracements identify where pullbacks are likely to find support within a trend. Key levels: 38.2%, 50%, and 61.8%.
- • 38.2%: Shallow pullback — strong trend likely to continue
- • 50%: Half-way retracement — moderate pullback
- • 61.8%: The "golden ratio" — deep pullback, last line of defence for the trend
Fib levels become very powerful when they align with horizontal S&R. For example, if the 61.8% retracement lands exactly on a previous swing high — that's a high-confidence support zone.
Multi-Timeframe S&R Analysis
A support level from the weekly chart carries far more weight than one from the 15-minute chart. The key is layering timeframes to find where multiple levels converge:
Three-Layer Approach
Weekly/Daily — Major S&R
These are your "big picture" levels. They rarely break without significant volume and news. Mark 2-3 key levels from the daily/weekly chart.
4H/1H — Trading S&R
These are your entry/exit levels. They're strong enough to cause reactions but can break during a trend. Mark 2-4 levels from your trading timeframe.
15M/5M — Precision S&R
Use for fine-tuning entries when price approaches a higher-timeframe level. These minor levels help you get a tighter stop loss.
Confluence Example:
BTC is approaching $60,000 — a round number (psychological level), the weekly 200 SMA ($60,200), and the 61.8% Fibonacci retracement ($59,800). Three S&R methods pointing to the same zone. This is an extremely high-probability support area.
Confirming S&R with the Order Book
Support and resistance isn't just a chart concept — you can see it forming in real time on the Level 2 order book:
Confirming Support
Look for a large cluster of bid orders (buy orders) at or near your support level. If there are 50,000 shares sitting at $49.90-$50.00 and the stock is approaching $50, that's real buying interest backing up the level. The bigger the bid wall relative to typical order sizes, the stronger the support.
Confirming Resistance
Look for a large cluster of ask orders (sell orders) at your resistance level. Heavy selling interest stacked at $55.00 confirms that level as resistance. Watch what happens as price approaches — if the orders get pulled (disappear), the level may break.
Warning: Spoofing
Large orders on the book aren't always genuine. Some traders place large orders to create the appearance of support/resistance, then cancel them before execution. If a large wall appears and disappears repeatedly, it may be manipulative rather than genuine supply/demand.
Role Reversal: The Key Concept
When support breaks, it becomes resistance.
When resistance breaks, it becomes support.
This is one of the most powerful concepts in technical analysis. Traders who bought at the old support are now underwater and will sell at breakeven. This creates selling pressure (new resistance).
Trading the Retest
Price breaks through support/resistance
Price comes back to "retest" the level from the other side
If the level holds as new S/R, enter in the direction of the breakout
Stop loss just beyond the level, target the next S/R
Pro Tip: Retest entries are lower risk than breakout entries because you're waiting for confirmation that the level has flipped.
Zones vs Lines
Think of S&R as zones, not exact lines. Price rarely reverses at exactly the same pip.
Wrong Approach
"Support is at exactly $67,423.50"
Too precise - will get stopped out by normal noise
Right Approach
"Support zone between $67,000 - $67,500"
Gives price room to react naturally
Rule of thumb: Make your zone 0.5-1% of the price on daily charts.
Trading Strategies
1. Bounce Trading (Mean Reversion)
Buy at support, sell at resistance. Works in ranging markets.
Entry: When price touches support zone with confirmation (bullish candle)
Stop Loss: Below the support zone
Take Profit: Near resistance, or trail stop
2. Breakout Trading
Trade in the direction of the break when S&R fails.
Entry: After price closes beyond the level with volume
Stop Loss: Back inside the broken level
Take Profit: Next S&R level or measured move
3. Retest Trading (Safest)
Wait for breakout, then enter on the retest of broken level.
Entry: When price retests broken level and holds
Stop Loss: If level breaks back the other way
Take Profit: Next S&R level
Best risk-reward because you get tight stops and confirmation.
What Makes a Level Strong?
| Factor | Why It Matters |
|---|---|
| Number of Touches | More touches = more traders watching = stronger reaction |
| Timeframe | Weekly S&R > Daily S&R > Hourly S&R |
| Volume at Level | High volume reversals create stronger memory |
| Recency | Recent levels are more relevant than old ones |
| Confluence | Level that aligns with MA, Fib, round number = very strong |
Common Mistakes
Drawing Too Many Levels
If you draw 20 lines, of course price will hit one. Focus on the 2-3 most significant levels on your timeframe.
Expecting Exact Touches
Price might reverse $5 before your line or overshoot by $10. Think zones, not lines.
Ignoring the Trend
In a strong uptrend, resistance is more likely to break. In a downtrend, support is more likely to break. Trade with the trend.
No Stop Loss
S&R levels fail all the time. Always have a stop loss in case the level doesn't hold.
Remember
- • S&R shows where price might react, not where it will
- • Levels break - that's what creates trends
- • Combine with other tools (RSI, candlestick patterns) for confirmation
- • Practice identifying levels before risking real money
Further Reading
- Investopedia: Support and resistance basics — How to identify key price levels
- CME Group: Introduction to technical analysis — Derivatives exchange educational resource
Written by Ryan Clinton
Founder of Nydar. Software engineer with experience at Cowen Inc (Wall Street) and on large-scale infrastructure projects. Built Nydar to make professional trading tools accessible to everyone.
Last reviewed: March 2026