Footprint Chart
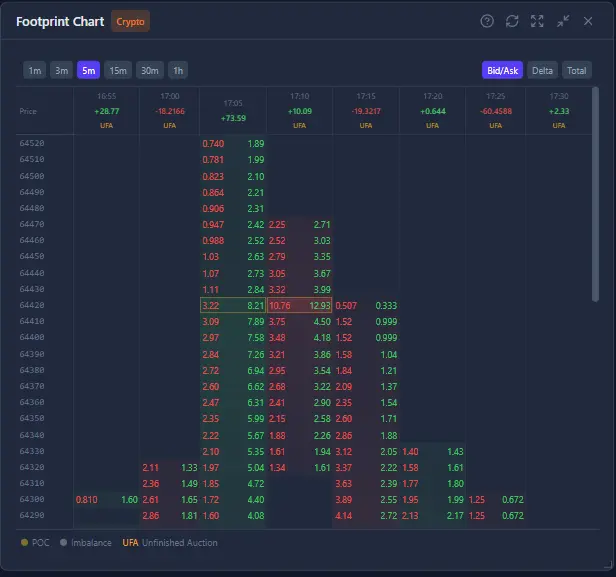
Nydar's footprint chart shows bid vs ask volume at every price level inside each candle with delta and absorption detection
What Is Nydar's Footprint Chart Widget?
Nydar's Footprint Chart breaks each candle open and reveals the bid volume vs ask volume at every price level inside that bar, with automatic 3:1 imbalance detection and stacked-imbalance alerts across consecutive price levels. A normal candlestick chart only shows open, high, low, and close — Nydar's footprint shows the internal battle.
Nydar highlights exactly where buyers and sellers fought, who won at each level, and by how much. This is the primary tool used by professional order flow traders to read market microstructure. The theoretical basis for volume-at-price analysis is laid out in Maureen O'Hara's Market Microstructure Theory (Blackwell, 1995), which explains how trade size and direction encode information, and Jim Dalton's Mind Over Markets (Traders Press, 1990), which introduced Market Profile and the concept of value areas that underpin footprint chart interpretation.
Nydar's Key Concepts
Imbalances (3:1+ ratio)
When one side overwhelms the other at a price level by a ratio of 3:1 or greater, Nydar highlights it automatically. Nydar colours buy imbalances green and sell imbalances red, showing where aggressive directional activity occurred.
Stacked Imbalances
Nydar detects three or more consecutive price levels with the same directional imbalance. This is one of the strongest signals in order flow analysis — Nydar's stacked imbalance alerts indicate a large aggressive order being worked across multiple levels.
Point of Control (POC)
Nydar marks the price level with the highest total volume inside each candle. This is where the most trading activity occurred and often acts as a magnet for future price action.
Unfinished Auctions
Nydar identifies when the high or low of a bar has zero volume on one side — the auction at that extreme was never completed. Price is statistically likely to revisit these levels to finish the auction.
Net Delta Per Bar
Nydar calculates the total buy volume minus sell volume for each candle, colour-coded to show the overall character of the bar at a glance. Positive delta = net buying, negative delta = net selling.
How to Read Nydar's Footprint Data
Nydar's Pro Tips
- Focus on Nydar's stacked imbalances — they are the highest-probability signals
- Nydar flags unfinished auctions at session highs/lows — strong magnets for price
- Combine with Nydar's Volume Profile widget to see where POC and value area align
- Use Nydar's Level 2 heatmap alongside to see resting orders vs executed flow
- Higher timeframes (15m, 1h) produce more reliable imbalance signals in Nydar's footprint
Related Nydar Topics
How Footprint Compares to Other Nydar Widgets
| Feature | Footprint Chart | Volume Delta | Order Flow | Level 2 / DOM | Volume Profile |
|---|---|---|---|---|---|
| Bid vs ask per price level | Inside each candle | Net only | Tape-level | Resting orders only | No side split |
| Imbalance detection | 3:1 auto + stacked | Cumulative delta | Large trade flags | Bid/ask ratio | No |
| Point of Control (POC) | Per candle | No | No | No | Per session |
| Historical candle data | Yes | Yes | Real-time only | Snapshot only | Yes |
| Absorption detection | Built-in | Divergence only | Manual | Wall watch | No |
| Best paired with | Volume Profile | Footprint | Level 2 | Footprint + Chart | Footprint |
Further Reading
Last reviewed: March 2026