Options Trading Widgets
Nydar's options widgets provide IV percentile, Greeks, unusual flow detection, sweep tracking, and max pain analysis across US equity options
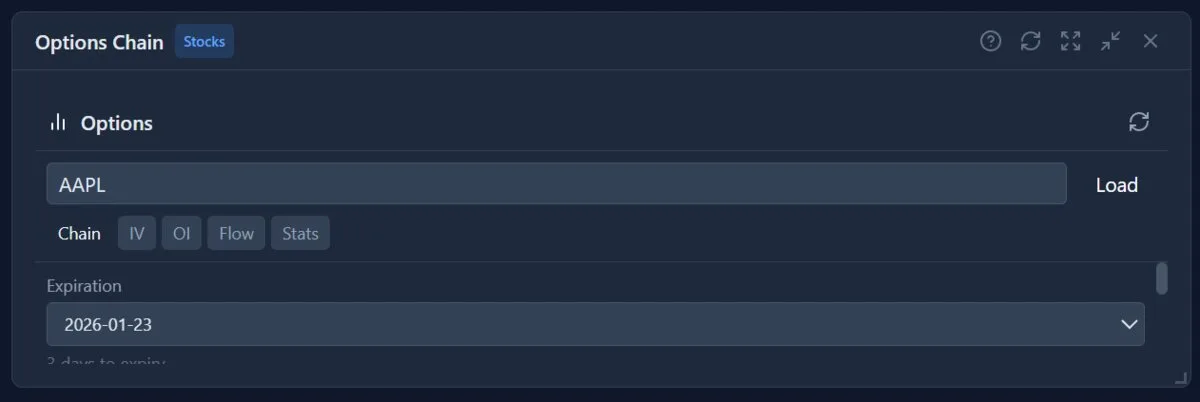
What Is Nydar's Options Trading Widget?
Nydar provides two options widgets: Nydar's Options Chain widget for detailed single-symbol analysis, and Nydar's Options Flow widget for scanning unusual activity across multiple stocks.
Nydar's options tools help you identify institutional activity, analyze implied volatility, understand market sentiment through put/call ratios, and find the max pain strike price.
The pricing models behind these tools trace back to the foundational work of Fischer Black and Myron Scholes, "The Pricing of Options and Corporate Liabilities" (Journal of Political Economy, 1973), which introduced the closed-form solution for European option pricing still used across the industry today. For a comprehensive modern treatment covering Greeks, volatility surfaces, and exotic structures, see John C. Hull, Options, Futures, and Other Derivatives (11th ed., Pearson, 2022) — the standard graduate-level reference used by most institutional desks.
Nydar's Options Chain Widget
Enter any US stock symbol to view Nydar's detailed options data. Use the tabs to switch between different views:
Chain View
Nydar's chain view displays all calls and puts for a selected expiration, showing strike price, last price, bid/ask, volume, open interest, and implied volatility. ITM contracts are highlighted.
IV View
Nydar's IV analysis displays IV Rank, IV Percentile, 52-week IV range, and Expected Move calculations. Essential for premium selling strategies.
OI View
Nydar's OI view displays open interest distribution by strike price, visualizing where traders have positioned and helping identify potential support/resistance levels and the max pain price.
Flow View
Nydar's flow view tracks single-symbol unusual activity, showing options with high volume relative to open interest, which may indicate institutional positioning.
Stats View
Nydar's stats view displays summary statistics including put/call ratio (volume and OI), max pain analysis, total volume, and sentiment interpretation.
Nydar's Options Flow Widget
Nydar's dedicated Options Flow scanner monitors unusual activity across popular options-active stocks (SPY, QQQ, AAPL, MSFT, NVDA, TSLA, and more) in real-time.
Filter Options
- All: Show all unusual activity
- Bullish: Only call buying / put selling
- Bearish: Only put buying / call selling
- $100K+: Large premium trades only
Sweep Detection
Nydar flags trades as "SWEEP" when volume exceeds open interest by 3x or more. These are aggressive trades that often indicate urgency from institutional traders.
Key Concepts
IV Rank & IV Percentile
IV Rank: Where current IV sits in the 52-week range (0-100).
IV Percentile: Percentage of days IV was lower than current level.
Low IV (0-25): Good for buying options
High IV (75+): Good for selling premium
Max Pain
The strike price where option sellers (market makers) lose the least money at expiration. Theory suggests stock prices tend to gravitate toward max pain as expiration approaches.
Put/Call Ratio
Measures the ratio of put volume/OI to call volume/OI.
< 0.7: Bullish sentiment (more calls)
0.7 - 1.3: Neutral
> 1.3: Bearish sentiment or hedging
Expected Move
The expected price range based on implied volatility and days to expiration.
1σ (68% probability): Price likely stays within this range
2σ (95% probability): Extended range for risk management
How to Use Options Data
1. Assess Volatility First
Check Nydar's IV Rank before any trade. High IV = expensive options (sell premium). Low IV = cheap options (buy premium). Nydar's IV view helps you avoid overpaying for volatility.
2. Watch for Unusual Flow
Large premium trades ($100K+) with high volume/OI ratios often indicate institutional activity. Follow the smart money, but verify with technicals.
3. Use Max Pain as a Guide
As expiration approaches, watch if price is gravitating toward max pain. This can help with timing entries and exits for directional trades.
4. Size Positions with Expected Move
Use the expected move to set realistic profit targets and stop losses. If selling premium, the 1σ range is where you expect price to stay.
The Options Greeks
Nydar's chain view displays all four Greeks for every contract. Understanding Greeks is essential for managing risk and selecting the right strategy.
Delta (Δ)
DirectionHow much the option price moves per $1 move in the stock. Calls have positive delta (0 to 1), puts have negative delta (0 to -1).
ITM
0.6 - 1.0
ATM
~0.50
OTM
0.0 - 0.4
Pro tip: Delta also approximates the probability of expiring in-the-money.
Gamma (Γ)
AccelerationRate of change in delta per $1 stock move. Highest for at-the-money options near expiration. Think of it as delta's "acceleration."
High gamma = delta changes rapidly = position becomes harder to hedge. Near expiration, ATM options have extreme gamma ("gamma risk").
Theta (Θ)
Time DecayHow much value the option loses per day. Always negative for option buyers (time works against you). Accelerates as expiration approaches.
Option sellers profit from theta — they want time to pass quickly.
Option buyers fight theta — they need the stock to move before time erodes their premium.
Vega (ν)
VolatilityHow much the option price changes per 1% change in implied volatility. Positive for long options — higher IV = more expensive premium.
Vega is highest for at-the-money options with longer expirations. Buying options before earnings (when IV rises) and selling after (when IV collapses) is a common vega play.
IV Rank Strategy Guide
IV Rank tells you whether current implied volatility is historically high or low. This single number should drive your strategy selection.
| IV Rank | Premium | Strategy | Examples |
|---|---|---|---|
| 0 - 25 (Low) | Cheap | Buy premium | Long calls/puts, debit spreads, long straddles |
| 25 - 50 | Fair | Neutral | Directional trades, calendars |
| 50 - 75 | Elevated | Lean sell | Credit spreads, covered calls |
| 75 - 100 (High) | Expensive | Sell premium | Iron condors, short strangles, cash-secured puts |
Earnings warning: IV Rank often spikes before earnings, then collapses immediately after (IV crush). Never buy options before earnings without understanding that you're paying an inflated premium that will evaporate overnight.
Strategy Selection Guide
Choose your options strategy based on your directional outlook and volatility view.
| Your View | Low IV | High IV |
|---|---|---|
| Bullish | Long call, bull call spread | Bull put spread, cash-secured put |
| Bearish | Long put, bear put spread | Bear call spread, covered call |
| Neutral | Calendar spread | Iron condor, short strangle |
| Big move expected | Long straddle, long strangle | Debit straddle (risky — IV already high) |
Key principle: When you buy options, you want IV to rise after entry. When you sell options, you want IV to fall. Always know which side of volatility you're on before placing the trade. For a deeper introduction, see Nydar's Options Trading Basics tutorial.
Pro Tips
- Combine IV with direction: High IV + bearish flow = potential drop. Low IV + bullish flow = upside setup.
- Watch OI build-up: High open interest at a strike often acts as a magnet or wall for price.
- SWEEP orders matter: When you see multiple sweeps in the same direction, institutions are aggressively positioning.
- Expiration matters: Max pain is most relevant in the final week before expiration.
Important Notes
- Nydar's options data is delayed: Nydar uses free data sources with 15-minute delays. Real-time data requires premium providers.
- US stocks only: Nydar's options chain data is available for US-listed stocks only.
- Not financial advice: Options are complex derivatives. Nydar's unusual flow detection is informational, not a trading signal.
- Greeks are estimates: Nydar calculates Greeks using the Black-Scholes model which has limitations.
How Does This Widget Compare to Other Nydar Widgets?
Nydar offers several widgets that surface options and derivatives data. Here is how they differ:
| Feature | Options Chain | Options Flow | Max Pain | GEX |
|---|---|---|---|---|
| Greeks (Delta, Gamma, Theta, Vega) | Yes — per contract | No | No | Gamma only |
| IV Rank / IV Percentile | Yes — 52-week range | No | No | No |
| Unusual activity / sweep detection | Single symbol | Multi-symbol scanner | No | No |
| Open interest distribution | Yes — by strike | No | Yes — visualised | Gamma-weighted |
| Max pain strike | Yes | No | Primary focus | No |
| Expected move calculation | 1-sigma and 2-sigma | No | No | No |
| Best for | Single-symbol deep analysis | Spotting institutional trades | Expiration-week targets | Dealer hedging pressure |
Related Resources
Further Reading
Last reviewed: March 2026