Market Scanner
Nydar's market scanner finds trading opportunities across all supported symbols using technical and momentum filters
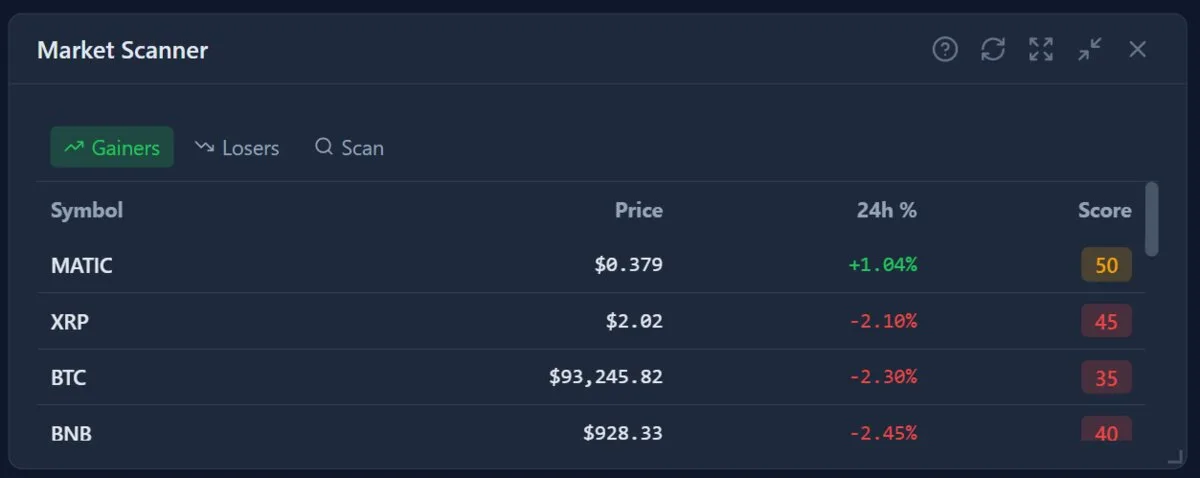
What Is Nydar's Market Scanner Widget?
Nydar's Market Scanner automatically searches across all available crypto, stock, and forex symbols to find ones matching specific criteria. Instead of manually checking hundreds of charts, Nydar runs 24 pre-built scans covering momentum, trend, volume, and fundamentals to surface potential opportunities in seconds.
Systematic stock screening has a long academic pedigree. William J. O'Neil's CANSLIM methodology, detailed in How to Make Money in Stocks (McGraw-Hill, 4th ed., 2009), showed that combining earnings growth, relative strength, and volume criteria identified stocks that went on to outperform the S&P 500 by an average of 2.6x over 12 months. More recently, Jegadeesh and Titman's foundational study "Returns to Buying Winners and Selling Losers" (Journal of Finance, 1993, vol. 48, no. 1, pp. 65-91) demonstrated that momentum-based screening generates statistically significant excess returns over 3-12 month holding periods.
Nydar's Pre-Built Screener Presets
Nydar's Market Scanner includes 24 pre-built presets organized into 4 categories: Quick Scans, Momentum, Trend, and Fundamentals. Click any preset to instantly apply Nydar's scan logic.
Quick Scans
Top Gainers
Biggest price increases with solid volume
Top Losers
Biggest price drops with solid volume
Unusual Volume
Volume 300%+ of average
New Highs / Lows
Stocks near 52-week high or low
Momentum
Momentum Leaders
Price above all major SMAs with RSI > 50
RSI Oversold / Overbought
RSI below 30 or above 70
Oversold Bounce
Oversold showing reversal signs
Trend
Golden Cross / Death Cross
50 SMA crossing 200 SMA
Strong Trend
ADX > 25 with momentum confirmation
Breakdown Watch
Breaking below 50 SMA with volume spike
Fundamentals (Stocks Only)
Value Stocks
Low P/E, low P/B, pays dividends
Dividend Champions
High yield with reasonable valuation
Growth Stocks
EPS and revenue growth > 15%
Profitable & Efficient
High ROE, solid margins
How to Use Nydar's Market Scanner
Step 1: Select Scanner Type
Choose which criteria you want Nydar's scanner to filter for from the dropdown.
Step 2: Review Results
Nydar displays matching symbols ranked by the relevant metric (e.g. % change, volume ratio, RSI).
Step 3: Click to Analyze
Click any result to load that symbol across Nydar's Chart, Order Book, and other widgets for deeper analysis.
Step 4: Confirm with Chart
Always check Nydar's Chart before trading. Nydar's scanner finds candidates, you confirm the setup.
Important Notes
- Scanner ≠ signals: Just because something appears in Nydar's scanner doesn't mean you should trade it. It's a filter, not a recommendation.
- Refresh for updates: Nydar captures a snapshot at the time of scan. Refresh to get the latest readings.
- Volume context: High volume for one symbol might be normal for another. Compare to that symbol's average.
Pro Tips
- Morning routine: Start each day using Nydar's scanner on top gainers/losers to see what's moving.
- Volume + price action: Nydar's volume scans are most significant when combined with breakout price action.
- Oversold ≠ buy: Nydar's RSI oversold scan in a downtrend can stay oversold. Wait for reversal confirmation.
- Add to watchlist: When you find interesting scanner hits, add them to Nydar's Watchlist for monitoring.
Learn More
Deepen your understanding with these guides:
Related Widgets
How Market Scanner Compares to Other Nydar Widgets
| Feature | Market Scanner | Watchlist | Heatmap | AI Signals | Daily Picks |
|---|---|---|---|---|---|
| Primary focus | Find new opportunities | Track chosen symbols | Visual market overview | ML buy/sell signals | Curated top picks |
| Number of presets | 24 across 4 categories | N/A (user-defined) | 3 (crypto, stocks, forex) | N/A (model-driven) | 1 per day |
| Covers fundamentals | Yes (P/E, ROE, dividends) | No | No | No | No |
| User interaction | Select preset, click result | Add/remove symbols | Click sector/symbol | View signal + confidence | View daily list |
| Multi-asset | Crypto, stocks, forex | All assets | All assets | All assets | Stocks only |
| Volume analysis | Unusual volume, spikes | Shows current volume | Size = volume | Used in model | No |
| Best used for | Morning scan routine | Ongoing monitoring | Sector rotation | Entry timing | Quick ideas |
Further Reading
Last reviewed: March 2026