Volume Delta (CVD)
Nydar's volume delta widget measures cumulative buying vs selling pressure to identify trend strength and divergences
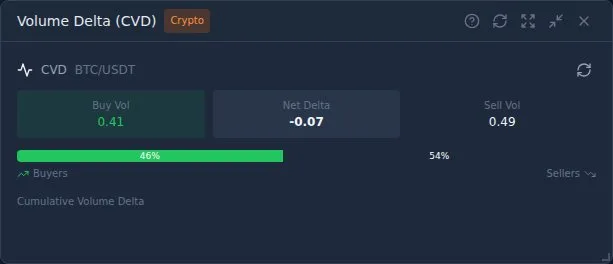
What Is Nydar's Volume Delta Widget?
Nydar's Volume Delta widget measures the difference between buying volume and selling volume in real time. When buyers are more aggressive (hitting the ask), delta is positive. When sellers dominate (hitting the bid), delta is negative.
Nydar calculates Cumulative Volume Delta (CVD) by tracking this imbalance over time, revealing the underlying pressure behind price movements that standard volume bars miss.
The academic foundation for trade classification comes from Hasbrouck (1991), "Measuring the Information Content of Stock Trades," The Journal of Finance, 46(1), 179-207, which demonstrated that trade direction carries significant information about future price movements. Lee and Ready (1991), "Inferring Trade Direction from Intraday Data," The Journal of Finance, 46(2), 733-746, established the tick test and quote-based methods Nydar uses to classify each trade as buyer- or seller-initiated. More recently, Easley, Lopez de Prado, and O'Hara (2012) showed in "Flow Toxicity and Liquidity in a High-Frequency World," The Review of Financial Studies, 25(5), 1457-1493, that order flow imbalance (the core metric behind CVD) is a reliable predictor of short-term price dislocations.
Nydar's Volume Delta Metrics
Nydar classifies trades that hit the ask price
Nydar classifies trades that hit the bid price
Nydar calculates the difference between buy and sell volume. Positive = more buying pressure, negative = more selling pressure.
Nydar's running total of delta over time. Shows the trend of buying vs selling pressure, not just the current snapshot.
Reading Divergences in Nydar
Nydar's Volume Delta widget highlights divergences between price and CVD — among the most powerful signals in order flow analysis:
Pro Tips
- Nydar's CVD trending with price = trend confirmation, likely to continue
- Nydar's CVD diverging from price = warning sign, watch for reversal
- Sudden spikes in Nydar's CVD often precede sharp price moves
- Pair with Nydar's Order Flow widget for a complete picture
- Nydar's CVD is more reliable on higher timeframes and liquid markets
Nydar's CVD Trading Strategies
Trend Confirmation
When Nydar's CVD is trending up alongside price, it confirms genuine buying pressure behind the move. This is a high-conviction signal to stay in or add to long positions.
Absorption Detection
When Nydar's CVD is rising strongly but price is flat or declining, large sellers are absorbing the buy orders. Nydar's Volume Delta widget highlights this pattern, which often precedes a sharp downward move once buying pressure exhausts.
CVD + Support/Resistance
At key support levels, a positive shift in Nydar's CVD signals real buying interest and a likely bounce. At resistance, Nydar's negative CVD shift signals distribution and a likely rejection.
Volume Delta vs Other Nydar Widgets
| Feature | Volume Delta | Order Flow | Footprint | Volume Profile | Level 2 |
|---|---|---|---|---|---|
| Primary focus | Buy/sell imbalance over time | Real-time trade flow | Volume at price per candle | Volume at price aggregate | Pending orders |
| Best for | Divergence detection | Momentum confirmation | Intrabar analysis | S/R identification | Liquidity mapping |
| Data type | Cumulative | Tick-by-tick | Per-candle breakdown | Session aggregate | Snapshot |
| Timeframe | All (best on 1H+) | Real-time only | All | Session/daily | Real-time only |
| Asset support | Crypto only | Crypto only | Crypto only | Crypto only | Crypto only |
| Pairs well with | Order Flow, Chart | Volume Delta, L2 | Volume Delta, Profile | Footprint, Chart | Order Flow, Delta |
Learn More
Deepen your understanding of Nydar's volume tools with these guides:
Related Nydar Topics
Further Reading
Last reviewed: March 2026