Advanced Chart
Nydar's advanced chart widget provides professional charting with 105 built-in indicators and multi-timeframe analysis
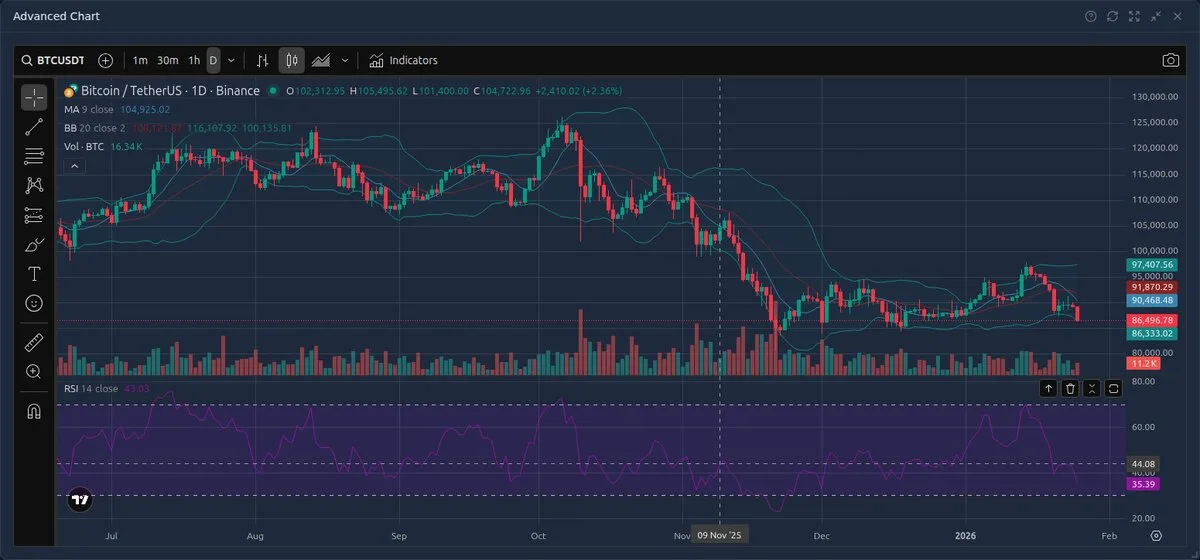
What Is Nydar's Advanced Chart Widget?
Nydar's Advanced Chart provides professional-grade charting with real-time data across crypto, stocks, and forex. Nydar automatically displays your selected symbol with pre-configured technical indicators including RSI, Moving Averages, and Bollinger Bands. John Murphy's Technical Analysis of the Financial Markets (1999) — widely considered the definitive reference for chart-based analysis — established the multi-indicator approach that Nydar's chart is built around.
Nydar's drawing tools follow principles laid out by Robert Edwards and John Magee in Technical Analysis of Stock Trends (first published 1948, now in its 11th edition), the oldest and most influential work on chart pattern analysis. Andrew Lo and Jasmina Hasanhodzic's The Evolution of Technical Analysis (2010) validated these methods with rigorous statistical evidence, showing that pattern recognition on charts has genuine predictive power when applied with discipline.
Nydar's Built-in Indicators
Nydar's Advanced Chart comes pre-loaded with essential technical indicators from Nydar's library of 105:
- RSI (Relative Strength Index)
Momentum oscillator measuring speed and change of price movements. Values above 70 indicate overbought, below 30 oversold.
- Moving Average (MA)
Shows the average price over a period. Helps identify trend direction and potential support/resistance levels.
- Bollinger Bands (BB)
Volatility bands placed above and below a moving average. Price touching bands can signal potential reversals.
Nydar's Chart Features
- Nydar's Symbol Search
Click the symbol name to search and switch to any instrument Nydar supports.
- Timeframe Selection
Nydar's Advanced Chart supports 1m, 5m, 15m, 30m, 1h, 4h, 1D, 1W and more.
- Drawing Tools
Access Nydar's trendlines, channels, Fibonacci retracements, and other drawing tools from the left toolbar.
- Additional Indicators
Click the "Indicators" button to add more technical indicators from Nydar's extensive library.
- Chart Types
Nydar's Advanced Chart supports candlestick, line, bar, Heikin Ashi, and other chart types.
Nydar's Symbol Mapping
Nydar automatically maps your selected symbol to the appropriate exchange:
- Crypto: Maps to crypto exchange (e.g., BTC/USDT → BTCUSDT)
- Stocks: Maps to NASDAQ (e.g., AAPL → NASDAQ:AAPL)
- Forex: Maps to FX (e.g., EUR_USD → FX:EURUSD)
Choosing the Right Timeframe in Nydar
Different timeframes serve different trading styles. Picking the wrong one leads to noise or missed entries:
| Timeframe | Trading Style | Hold Time | Best For |
|---|---|---|---|
| 1m / 5m | Scalping | Seconds to minutes | Quick reversals, momentum bursts |
| 15m / 30m | Day trading | Minutes to hours | Intraday patterns, session trends |
| 1h / 4h | Swing trading | Days to weeks | Trend reversals, pullback entries |
| 1D / 1W | Position trading | Weeks to months | Major trends, macro analysis |
Pro tip: Use 2-3 timeframes together. Identify the trend on the higher timeframe, then find entries on the lower one.
Nydar's Drawing Tools Guide
Nydar's chart toolbar provides drawing tools for marking up your analysis:
Trend Lines
Connect swing highs (descending trendline) or swing lows (ascending trendline). Price often reacts when it touches a well-established trendline. Use at least 2 touch points; 3+ makes it more reliable.
Horizontal Lines
Mark key support and resistance levels. Draw them at prices where price has repeatedly bounced or reversed. These are your buy/sell zones.
Fibonacci Retracement
Draw from swing low to swing high (uptrend) or high to low (downtrend). The 38.2%, 50%, and 61.8% levels are where pullbacks often find support. See the Fibonacci Trading guide.
Channels
Parallel trendlines enclosing price action. Buy at the lower channel boundary, sell at the upper. Channel breaks often lead to significant moves.
Common Nydar Chart Analysis Mistakes
Over-fitting trend lines
Drawing trendlines through candle bodies instead of wicks, or forcing a line to fit. A good trendline connects clean touch points. If you have to force it, it's not real.
Ignoring timeframe context
A bullish setup on the 5m chart means nothing if the 4h and daily are bearish. Always check higher timeframes before trading lower timeframe signals.
Too many indicators
Cluttering the chart with 10 indicators causes "analysis paralysis." Use 2-3 complementary indicators maximum: one for trend, one for momentum, one for volume.
Confirmation bias
Only seeing bullish patterns because you want to buy. Before entering any trade, actively look for reasons NOT to take it. If you can't find any, the setup might genuinely be good.
Tips
- • Use the scroll wheel to zoom in/out on Nydar's chart
- • Click and drag to pan across Nydar's chart history
- • Double-click to reset the view to fit all data
- • Right-click on Nydar's indicators to modify settings or remove them
- • Nydar's chart syncs with your dashboard symbol selection
How the Advanced Chart Compares to Other Nydar Widgets
| Feature | Advanced Chart | Price Chart | Indicators | Volume Profile | Footprint |
|---|---|---|---|---|---|
| Indicators | 105 built-in | None | 105 standalone | Volume at price | Bid/ask volume |
| Drawing tools | Full suite | None | None | None | None |
| Chart types | 6+ (candle, line, bar, Heikin Ashi) | Candlestick only | Line charts | Histogram | Heatmap grid |
| Timeframes | 1m to 1W (8 options) | 1m to 1D | Matches chart | Session-based | Per candle |
| Asset classes | Crypto, stocks, forex | Crypto, stocks, forex | Crypto, stocks, forex | Crypto only | Crypto only |
| Best for | Full technical analysis | Quick price check | Indicator-only view | Key price levels | Order flow at price |
Related Resources
Further Reading
Last reviewed: March 2026