Custom Indicator Builder
Nydar's custom indicator builder is a Pine Script-compatible formula engine with 29 built-in functions for creating technical indicators that run against live market data across crypto, stocks, and forex. Full syntax reference and 11 ready-to-use examples below.
Overview
Nydar's custom indicator builder lets you create your own technical indicators using a formula language similar to Pine Script. Combine 29 built-in functions — moving averages, momentum oscillators, trend filters, crossover detection, and more — to build indicators that match your exact trading strategy.
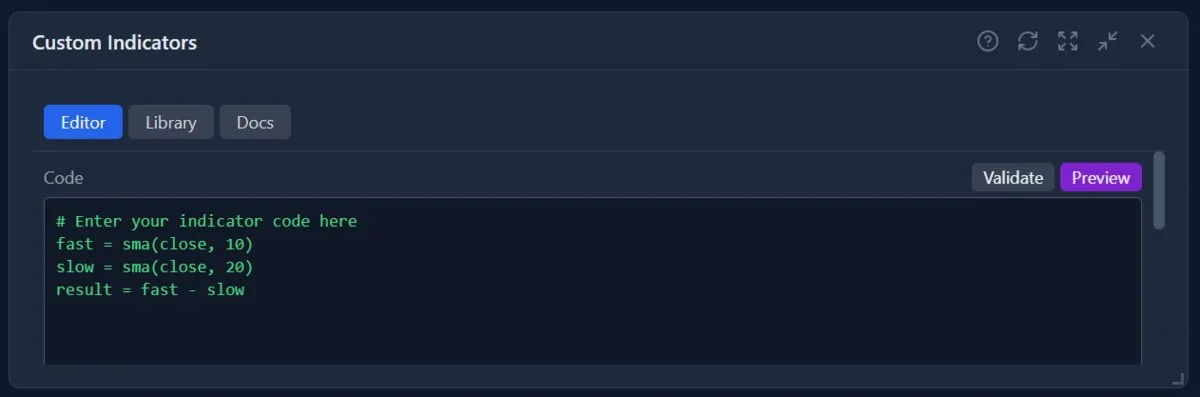
Write your formula in the code editor, validate it instantly, preview the output on live market data, then save it to your indicator library. Custom indicators can be overlaid directly on price charts or displayed in a separate pane. The built-in function library covers the indicator categories defined by John Murphy in Technical Analysis of the Financial Markets (New York Institute of Finance, 1999) — trend, momentum, volatility, and volume. Many of the momentum and trend functions available in Nydar's builder originate from Martin J. Pring's Technical Analysis Explained (McGraw-Hill, 5th ed., 2002), which remains one of the most widely cited references on oscillator construction and signal interpretation. The crossover detection system draws on the same directional movement framework published by J. Welles Wilder in New Concepts in Technical Trading Systems (Trend Research, 1978).
Quick Start
Here's a simple custom indicator that calculates the distance between two moving averages as a percentage, useful for spotting trend strength and potential reversals:
# Distance between fast and slow moving averages
fast = ema(close, 9)
slow = ema(close, 21)
result = (fast - slow) / slow * 100
Positive values mean the fast MA is above the slow MA (bullish). Negative values mean it's below (bearish). The further from zero, the stronger the trend. Values returning toward zero suggest the trend is weakening.
Syntax Reference
Price Variables
These are available automatically — each is a full data series covering the entire chart history:
openOpening price
highHigh price
lowLow price
closeClosing price
volumeTrade volume
hl2(high + low) / 2
hlc3(H + L + C) / 3
ohlc4(O + H + L + C) / 4
Operators
Math
+ Addition- Subtraction* Multiplication/ Division% Modulo** PowerComparison
> Greater than< Less than>= Greater or equal<= Less or equal== Equal!= Not equalAssignment & Comments
# This is a comment — everything after # is ignored
my_ma = sma(close, 20)
my_rsi = rsi(close, 14)
result = my_ma * my_rsi  # The last variable is returned
Each line assigns a value to a variable. The last assigned variable (or one named result) is what gets plotted on the chart.
Lookback (Historical Values)
Access previous bar values using square brackets. Maximum lookback is 100 bars.
# Previous bar's close
prev_close = close[1]

# Close from 5 bars ago
old_close = close[5]

# Simple price change
price_change = close - close[1]
Conditionals
Two ways to write conditional logic:
# Method 1: if-then-else syntax
signal = if rsi(close, 14) > 70 then -1 else 1

# Method 2: iff() function
signal = iff(rsi(close, 14) > 70, -1, 1)
Coming from Pine Script?
If you've written indicators in Pine Script, most concepts transfer directly. Here's what's the same and what's different:
Works the Same
close,open,high,low,volume— identical price variablesclose[1]— lookback syntax is the samesma(close, 20)— most function names and signatures matchta.crossover(a, b)→crossover(a, b)— same logic, nota.prefix- Variable assignment:
my_var = sma(close, 14) - Comments with
# - Arithmetic:
+ - * / %and comparisons
What's Different
- No
//@version,indicator(), orstrategy()declarations - No
plot()— the last variable is automatically plotted - No
ta.prefix — callrsi()directly, notta.rsi() - Ternary: use
if x then y else zoriff(x, y, z)instead ofx ? y : z - No
varkeyword — variables are automatically series-based - No
forloops — use rolling functions instead - No
input()— parameters are hardcoded in the formula
Side-by-Side Example
Pine Script
//@version=5
indicator("DI Crossover")
len = input(14)
dip = ta.plus_di(len)
dim = ta.minus_di(len)
adxVal = ta.adx(len)
signal = ta.crossover(dip, dim)
       and adxVal > 25 ? 1 : 0
plot(signal)
hline(0)
Nydar Formula
dip = di_plus(high, low, close, 14)
dim = di_minus(high, low, close, 14)
trend = adx(high, low, close, 14)
buy = crossover(dip, dim)
trending = iff(trend > 25, 1, 0)
result = buy * trending
The same logic in fewer lines. No boilerplate declarations, no plotting commands — just the formula. Note that Nydar's functions require explicit high, low, close arguments where Pine Script uses them implicitly.
Function Reference
Moving Averages
sma(series, period)Simple Moving Average. The unweighted mean of the last period values. Most common moving average — treats all bars equally.
sma_20 = sma(close, 20)
ema(series, period)Exponential Moving Average. Gives more weight to recent values, making it more responsive to new data than SMA. Widely used for trend direction and dynamic support/resistance.
fast = ema(close, 9)
slow = ema(close, 21)
wma(series, period)Weighted Moving Average. Linearly weighted — the most recent bar has the highest weight, decreasing linearly to the oldest bar in the window.
wma_14 = wma(close, 14)
vwma(series, volume, period)Volume Weighted Moving Average. Weights each price by its volume, so high-volume bars have more influence. Useful for identifying the "true" average price institutions traded at.
vwma_20 = vwma(close, volume, 20)
# Price above VWMA = bullish volume bias
result = close - vwma_20
Momentum
rsi(series, period)Relative Strength Index. Oscillates 0-100. Above 70 is overbought, below 30 is oversold. Standard period is 14.
rsi_val = rsi(close, 14)
# Smoothed RSI with moving average
result = sma(rsi_val, 5)
roc(series, period)Rate of Change. Percentage change from period bars ago. Positive = price rising, negative = price falling. Useful for momentum divergence analysis.
result = roc(close, 12)
mom(series, period)Momentum. Absolute price difference from period bars ago (unlike ROC which is percentage-based). Good for comparing momentum across timeframes.
result = mom(close, 10)
cci(high, low, close, period)Commodity Channel Index. Measures price deviation from the statistical mean. Values above +100 suggest an uptrend, below -100 suggest a downtrend. Requires high, low, and close.
result = cci(high, low, close, 20)
Trend
adx(high, low, close, period)Average Directional Index. Measures trend strength regardless of direction (0-100). Below 20 = weak/no trend, 20-40 = developing trend, above 40 = strong trend. Does NOT tell you the direction — use di_plus and di_minus for that.
trend_strength = adx(high, low, close, 14)
# Filter: only trade when trend is strong enough
result = iff(trend_strength > 25, 1, 0)
di_plus(high, low, close, period)Plus Directional Indicator (+DI). Measures the strength of upward price movement. When +DI is above -DI, buyers are dominant. Part of the DMI system developed by J. Welles Wilder.
dip = di_plus(high, low, close, 14)
dim = di_minus(high, low, close, 14)
# Bullish when +DI crosses above -DI
result = crossover(dip, dim)
di_minus(high, low, close, period)Minus Directional Indicator (-DI). Measures the strength of downward price movement. When -DI is above +DI, sellers are dominant. Use alongside +DI and ADX for a complete trend picture.
# DI spread: positive = bullish, negative = bearish
result = di_plus(high, low, close, 14) - di_minus(high, low, close, 14)
Volatility
atr(high, low, close, period)Average True Range. Measures volatility in absolute price terms. The true range accounts for gaps between bars. Commonly used for stop loss placement (e.g. 2x ATR below entry) and position sizing.
atr_val = atr(high, low, close, 14)
# Normalised ATR (percentage of price)
result = atr_val / close * 100
stdev(series, period)Standard Deviation. Statistical measure of price dispersion. Higher values = more volatile. Used internally by Bollinger Bands to set band width.
result = stdev(close, 20)
variance(series, period)Variance. The square of standard deviation. Useful when you need to compare volatility without the square root computation.
result = variance(close, 20)
Crossovers
crossover(series1, series2)Bullish crossover. Returns 1 on the bar where series1 crosses above series2, 0 otherwise. Detects the exact moment of the cross — only fires once per crossing.
# Golden cross: 50 EMA crosses above 200 EMA
result = crossover(ema(close, 50), ema(close, 200))
crossunder(series1, series2)Bearish crossover. Returns 1 on the bar where series1 crosses below series2, 0 otherwise.
# RSI leaving overbought territory
result = crossunder(rsi(close, 14), 70)
Aggregates
highest(series, period)Highest value in the last period bars. Useful for breakout detection and Donchian channels.
# Breakout indicator: 1 when price makes new 20-bar high
result = iff(close >= highest(high, 20), 1, 0)
lowest(series, period)Lowest value in the last period bars.
result = lowest(low, 20)
sum(series, period)Rolling sum of the last period values. Often used with volume to calculate cumulative volume.
# Volume surge: current vs 20-bar average
result = volume / (sum(volume, 20) / 20)
max(series, period)Rolling maximum (same as highest).
min(series, period)Rolling minimum (same as lowest).
mean(series, period)Rolling mean (same as sma).
Change
change(series, period=1)Absolute difference from period bars ago. Default is 1 (change from previous bar).
# Price change from 5 bars ago
result = change(close, 5)
pctchange(series, period=1)Percentage change from period bars ago, multiplied by 100. So a 5% move returns 5.0.
# Daily percentage change
result = pctchange(close, 1)
Math
abs(series)Absolute value. Useful for measuring magnitude regardless of direction.
sqrt(series)Square root.
log(series)Natural logarithm. Used in log-scale analysis and volatility calculations.
exp(series)Exponential (e^x).
pow(series, exponent)Raise to a power. Exponent must be between -100 and 100.
Conditional
iff(condition, then_value, else_value)If-then-else as a function. Returns then_value where condition is true, else_value where false.
# Score: +1 for bullish, -1 for bearish
result = iff(close > ema(close, 20), 1, -1)
valuewhen(condition, series, offset)Returns the value of series at the most recent bar where condition was true, shifted by offset bars.
# Price at last golden cross
last_cross_price = valuewhen(crossover(ema(close, 50), ema(close, 200)), close, 0)
result = close - last_cross_price
Complete Examples
ADX + DI Trend System
Combines trend strength (ADX) with trend direction (+DI/-DI) into a single indicator. Positive values mean a strong uptrend, negative means strong downtrend, near zero means no clear trend.
# ADX measures trend strength (0-100)
strength = adx(high, low, close, 14)

# DI+ and DI- measure trend direction
dip = di_plus(high, low, close, 14)
dim = di_minus(high, low, close, 14)

# Direction: positive when +DI > -DI (bullish)
direction = dip - dim

# Combine: direction weighted by strength
# Strong uptrend = large positive, strong downtrend = large negative
result = direction * strength / 25
DI Crossover Signals
Fires a signal when +DI crosses above -DI (buy) or below (sell), but only when the ADX confirms a trending market. This filters out choppy, sideways periods where crossovers are unreliable.
dip = di_plus(high, low, close, 14)
dim = di_minus(high, low, close, 14)
trend = adx(high, low, close, 14)

# Only signal when ADX > 20 (trending market)
buy = crossover(dip, dim)
trending = iff(trend > 20, 1, 0)
result = buy * trending
MACD Histogram
The classic MACD histogram — the difference between the MACD line and its signal line. Positive and rising = strengthening bullish momentum.
fast = ema(close, 12)
slow = ema(close, 26)
macd_line = fast - slow
signal = ema(macd_line, 9)
result = macd_line - signal
Squeeze Momentum
Inspired by John Carter's TTM Squeeze. Measures where price sits within its Bollinger Bands as a percentage. Values near +100 mean price is at the upper band, near -100 at the lower band.
basis = sma(close, 20)
dev = stdev(close, 20)
upper = basis + dev * 2
lower = basis - dev * 2
result = (close - basis) / (upper - lower) * 100
ATR Volatility Position
Shows where price sits within ATR-based volatility bands. Values near 100 = near upper band (potentially overbought), near 0 = near lower band.
basis = ema(close, 20)
atr_val = atr(high, low, close, 14)
upper = basis + atr_val * 2
lower = basis - atr_val * 2
result = (close - lower) / (upper - lower) * 100
Volume Relative Strength
Volume as a multiple of its 20-period average, signed by candle direction. Values above +2 = high bullish volume, below -2 = high bearish volume.
avg_vol = sma(volume, 20)
vol_ratio = volume / avg_vol
# Positive for green candles, negative for red
result = iff(close > open, vol_ratio, vol_ratio * -1)
Multi-Condition Score
Combines multiple technical conditions into a single score. Each condition adds or subtracts 1 point. Higher scores = more conditions aligning bullishly.
# Trend: price above 50 EMA
t1 = iff(close > ema(close, 50), 1, -1)
# Momentum: RSI above 50
t2 = iff(rsi(close, 14) > 50, 1, -1)
# Volume: above average
t3 = iff(volume > sma(volume, 20), 1, -1)
# Trend strength: ADX trending
t4 = iff(adx(high, low, close, 14) > 20, 1, -1)
result = t1 + t2 + t3 + t4
Keltner Channel Position
Shows where price sits within ATR-based Keltner Channels as a percentage (0-100). Unlike Bollinger Bands which use standard deviation, Keltner Channels use ATR — making them less sensitive to sudden spikes.
# Keltner Channel: EMA centre, ATR bands
basis = ema(close, 20)
atr_val = atr(high, low, close, 10)
upper = basis + atr_val * 2
lower = basis - atr_val * 2

# Where is price within the channel?
# 100 = at upper band, 0 = at lower band
result = (close - lower) / (upper - lower) * 100
Stochastic-Style Oscillator
Recreates the core stochastic %K calculation — where price sits within its recent range. Values above 80 suggest overbought, below 20 suggest oversold. The smoothed version (%D) reduces noise.
# Raw %K: where close sits in 14-bar range
hi = highest(high, 14)
lo = lowest(low, 14)
pctk = (close - lo) / (hi - lo) * 100

# Smoothed %D: 3-period SMA of %K
result = sma(pctk, 3)
Mean Reversion Z-Score
Measures how many standard deviations price is from its moving average. Values above +2 or below -2 indicate statistically extreme moves likely to revert. Common in pairs trading and mean reversion strategies.
# How far is price from its 20-period mean?
avg = sma(close, 20)
sd = stdev(close, 20)

# Z-score: number of standard deviations
result = (close - avg) / sd
Choosing the Right Function
Not sure which function to use? Start from what you want to measure:
"Is the price trending or ranging?"
Use adx(). Values above 25 = trending, below 20 = ranging. This tells you whether to use trend-following strategies (moving average crossovers work well) or mean-reversion strategies (RSI overbought/oversold works well).
"Which direction is the trend?"
Use di_plus() and di_minus() together. When +DI > -DI, the trend is up. When -DI > +DI, the trend is down. For a simpler approach, check if price is above or below an EMA: iff(close > ema(close, 50), 1, -1).
"Is it overbought or oversold?"
Use rsi() (most common, range 0-100) or build a stochastic from highest() and lowest(). CCI is another option — above +100 is overbought, below -100 is oversold.
"How volatile is the market?"
Use atr() for absolute volatility (good for stop-loss sizing) or stdev() for statistical volatility (good for Bollinger Band-style analysis). Normalise ATR by dividing by close price to compare across different-priced assets.
"Did two lines just cross?"
Use crossover(a, b) for bullish crosses (a moves above b) or crossunder(a, b) for bearish crosses. These return 1 only on the exact bar of the cross, making them ideal for entry signals.
"Is volume confirming the move?"
Compare current volume to its average: volume / sma(volume, 20). Values above 2 mean volume is double the average — strong confirmation. Use vwma() to see where institutional volume is concentrated.
Common Errors & Troubleshooting
Unknown function: ta.rsi
Don't use the ta. prefix. Write rsi(close, 14) instead of ta.rsi(close, 14). Function names are called directly.
Function 'adx' expects 4 arguments, got 1
Unlike Pine Script where ta.adx(14) works, Nydar's DSL requires explicit price series: adx(high, low, close, 14). The same applies to atr(),cci(), di_plus(), and di_minus().
Period must be between 1 and 500
Function periods must be positive integers no greater than 500. If you're calculating the period dynamically, make sure it doesn't go out of range. Common mistake: sma(close, 0) — period must be at least 1.
Maximum lookback is 100 bars
You can reference up to 100 bars back with close[100]. If you need a longer lookback, use a rolling function instead: sma(close, 200) works (period up to 500), but close[200] does not.
Code exceeds maximum length of 2000 characters
Simplify your formula. Reuse variables instead of repeating function calls: instead of using ema(close, 20) in three places, assign it once: e20 = ema(close, 20) and reference e20.
Indicator shows NaN or blank values at the start
This is normal. Functions like sma(close, 20) need 20 bars of data before they can produce a value. The first 19 bars will be blank. Longer periods mean more blank bars at the start. This is called the "warm-up period" and happens in all technical analysis tools.
Division by zero producing infinite values
When dividing by a value that could be zero (like a range or volume), the result can spike to infinity. This commonly happens with (close - low) / (high - low) on doji candles where high equals low. No workaround needed for most cases — the chart handles it gracefully.
How to Create an Indicator
1. Open the Editor
Add the Custom Indicators widget to your dashboard. Click the code editor tab.
2. Write Your Formula
Use the functions and syntax above. Start with a simple example and modify it.
3. Validate
Click Validate to check for syntax errors without running the calculation. The editor will show any errors with specific messages.
4. Preview on Live Data
Click Preview to run the indicator against real market data. Choose your symbol (e.g. BTC/USDT) and timeframe (1h, 4h, 1d). The chart shows the most recent values so you can verify it looks correct.
5. Save to Library
Give your indicator a name, optional description, pick a colour, and choose whether to overlay on the price chart or display in a separate pane. Saved indicators appear in your personal library.
Limits & Tips
System Limits
- Max code length: 2,000 characters
- Max lookback: 100 bars
- Max period for functions: 500
- Max variables: 50
- Execution timeout: 5 seconds
Tips
- Use comments (
#) to document your logic - Name the output variable
resultfor clarity - Start by modifying an example — don't write from scratch
- Test on different timeframes to verify it works across scales
- Use
iff()to clamp values to a range
Frequently Asked Questions
What is di_plus in trading indicators?
In Nydar's custom indicator builder, di_plus (also written as +DI or Plus Directional Indicator) measures the strength of upward price movement. It's part of the Directional Movement Index (DMI) system created by J. Welles Wilder. When +DI is above -DI, buyers are in control. Combined with ADX (which measures trend strength on a 0-100 scale), DI+ and DI- form a complete trend analysis system. Nydar exposes all 3 DMI components as separate functions, so you can use di_plus(high, low, close, 14) with the standard 14-period lookback to calculate it.
Can I use Pine Script syntax here?
Nydar's formula language is similar to Pine Script but not identical. Core concepts transfer directly — variable assignment, function calls like sma() and ema(), and arithmetic operators work the same way. Nydar supports 29 built-in functions and 8 price variables (open, high, low, close, volume, hl2, hlc3, ohlc4), covering the same indicator categories as Pine Script. See the Pine Script comparison section above for a detailed side-by-side breakdown.
What's the difference between ADX, DI+, and DI-?
In Nydar's formula builder, ADX measures how strong a trend is (0-100) but doesn't tell you the direction. di_plus measures upward movement strength, and di_minus measures downward movement strength. When +DI > -DI, the trend is bullish. When -DI > +DI, the trend is bearish. ADX above 25 with +DI > -DI signals a strong uptrend. Nydar makes all 3 functions available separately so you can combine them into composite indicators — the "ADX + DI Trend System" example above shows one approach used by Nydar users.
How do I detect a moving average crossover?
Nydar provides dedicated crossover(series1, series2) and crossunder(series1, series2) functions for exactly this purpose. For example, crossover(ema(close, 9), ema(close, 21)) returns 1 on the exact bar where the 9 EMA crosses above the 21 EMA. These functions fire only once per crossing — they don't stay at 1 while one line is above the other. Nydar's crossover detection works across all 3 asset classes (crypto, stocks, forex) and all supported timeframes.
Can I combine multiple indicators into one?
Yes — that's one of the most powerful uses of Nydar's custom indicators. Assign each indicator to a variable, then combine them with math or iff() conditions. With 29 built-in functions and up to 50 variables per formula, Nydar gives you enough room to build complex composite indicators. See the "Multi-Condition Score" and "ADX + DI Trend System" examples above for two different approaches: scoring (add points for each bullish condition) and weighting (multiply direction by strength).
How Custom Indicators Compares to Other Nydar Widgets
| Feature | Custom Indicators | Technical Indicators | Advanced Chart | Backtest | Scanner |
|---|---|---|---|---|---|
| User-defined formulas | Yes (29 functions) | No | No | No | No |
| Pre-built indicators | 11 examples | 105 indicators | Overlay on chart | 5 strategies | Filter-based |
| Real-time data | Yes | Yes | Yes | Historical only | Yes |
| Chart overlay | Yes | Separate panel | Yes | Equity curve | No |
| Multi-asset support | Crypto, stocks, forex | Crypto, stocks, forex | Crypto, stocks, forex | Crypto, stocks, forex | Crypto, stocks, forex |
| Historical backtesting | No | No | No | Yes (equity curve + metrics) | No |
| Best for | Building unique signals | Quick indicator checks | Visual price analysis | Strategy validation | Finding opportunities |
Related
Further Reading
Last reviewed: February 2026