Moving Averages Guide
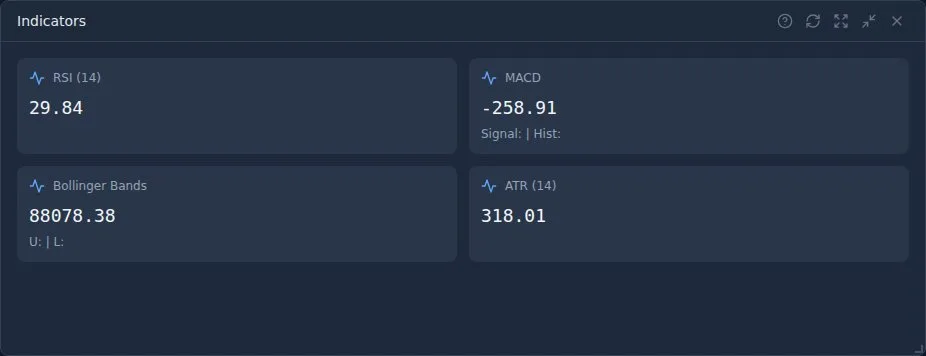
Nydar includes 12 moving average types (SMA, EMA, WMA, DEMA, TEMA, and more) across 15+ timeframes from 1-minute to monthly. Learn how MAs smooth price action, identify trends, and generate signals. Overlay them on any chart using Nydar's Indicators widget.
What is a Moving Average?
A moving average (MA) calculates the average price over a specific number of periods. As new prices come in, the oldest price drops off, creating a "moving" average that smooths out price noise and reveals the underlying trend.
Why Traders Love Moving Averages
Nydar's 12 MA types across 15+ timeframes let you instantly see if price is trending up or down
Price often bounces off key moving averages
Crossovers provide clear buy/sell signals
Filter out random price fluctuations
Key Insight: Moving averages are lagging indicators - they follow price, not predict it. They're best for confirming trends, not catching exact tops and bottoms.
SMA vs EMA: What's the Difference?
Simple Moving Average (SMA)
Calculates the straight average of prices over a period. Every price point gets equal weight.
Exponential Moving Average (EMA)
Gives more weight to recent prices, making it more responsive to new information.
When to Use Each
| Scenario | Best Choice | Why |
|---|---|---|
| Day trading | EMA | Need fast signals |
| Swing trading | SMA or EMA | Either works well |
| Long-term investing | SMA | Smooth out noise |
| Choppy markets | SMA | Fewer false signals |
Popular Moving Average Periods
Short-Term (10-20 periods)
FastReacts quickly to price changes. Used for timing entries and exits in active trading.
Common: 9 EMA, 10 SMA, 20 EMA
Medium-Term (50 periods)
BalancedThe "sweet spot" for many traders. Balances responsiveness with smoothness. Widely watched by institutions.
The 50 SMA/EMA often acts as dynamic support in uptrends
Long-Term (100-200 periods)
SlowDefines the major trend. Used to determine if you should be bullish or bearish overall.
The 200 SMA is the most watched MA on Wall Street
Pro Tip: The 200-Day SMA
When price is above the 200 SMA, the market is considered in a bull market. When below, it's a bear market. Many fund managers won't buy stocks trading below their 200 SMA.
Moving Average Trading Strategies
1. MA Crossover Strategy
Use two moving averages - one fast, one slow. Trade when they cross.
Fast MA crosses above slow MA = Buy signal
Example: 9 EMA crosses above 21 EMA
Fast MA crosses below slow MA = Sell signal
Example: 9 EMA crosses below 21 EMA
Popular combinations: 9/21 EMA, 10/20 SMA, 20/50 SMA
2. Golden Cross & Death Cross
The most famous MA signals, using 50 and 200 period moving averages.
50 SMA crosses above 200 SMA
Major bullish signal. Often marks the start of a new bull market.
50 SMA crosses below 200 SMA
Major bearish signal. Often confirms a bear market has begun.
Warning: These are lagging signals. By the time a golden/death cross occurs, the move may already be underway. Use for confirmation, not prediction.
3. Price vs Moving Average
Use the MA as dynamic support/resistance. Trade bounces off the MA.
4. Moving Average Ribbon
Plot multiple MAs (e.g., 10, 20, 30, 40, 50) to visualize trend strength.
MAs are fanned out in order (10 > 20 > 30 > 40 > 50) with price above all
MAs are fanned out in reverse order (10 < 20 < 30 < 40 < 50) with price below all
MAs bunching together = range-bound market, expect breakout soon
MAs spreading apart = trend gaining momentum, stay in the trade
Advanced Moving Average Types
Beyond SMA and EMA, several advanced moving averages offer unique advantages. These reduce lag while maintaining smoothness — solving the biggest limitation of traditional MAs.
DEMA (Double Exponential Moving Average)
Less LagApplies EMA twice to reduce lag. Reacts faster than a standard EMA of the same period while still filtering noise.
Best for: Swing traders who want faster signals than EMA without switching to shorter periods.
TEMA (Triple Exponential Moving Average)
Least LagTakes DEMA one step further. The fastest responding MA while still providing meaningful smoothing. Excellent for catching trend changes early.
Best for: Active traders who prioritize early signals and can tolerate occasional whipsaws.
Hull Moving Average (HMA)
Smooth + FastCreated by Alan Hull. Uses weighted moving averages with a square root period to virtually eliminate lag while remaining exceptionally smooth. Many traders consider it the best general-purpose MA.
Advantage: When the HMA changes direction, it's often an earlier signal than SMA or EMA crossovers of the same period.
Best for: Any timeframe. Particularly effective for trend-following on the daily chart.
VWMA (Volume Weighted Moving Average)
Volume-AwareWeights each price by its trading volume. High-volume price bars have more influence on the average than low-volume bars.
Best for: Stocks and crypto where volume varies significantly. Gives more weight to "real" price moves backed by volume.
Moving Average Envelopes
MA envelopes plot bands at a fixed percentage above and below a moving average. Unlike Bollinger Bands (which use standard deviation), envelopes use a constant percentage — making them simpler and more predictable.
Common Envelope Settings
| Style | MA Period | Envelope % | Use Case |
|---|---|---|---|
| Day trading | 20 EMA | 1-2% | Mean reversion entries |
| Swing trading | 50 SMA | 3-5% | Overbought/oversold zones |
| Position trading | 200 SMA | 5-10% | Extreme deviation from trend |
Buy Signal
Price touches or dips below the lower envelope in an uptrend. This indicates an oversold pullback — potential mean reversion long entry.
Sell Signal
Price touches or exceeds the upper envelope. This indicates overextension — potential profit-taking or short entry.
Dynamic Trailing Stops with MAs
Instead of using a fixed price for your stop loss, use a moving average as a dynamic trailing stop. The stop moves with the trend, locking in profits as price advances.
Aggressive: 10-20 EMA Stop
Exit when price closes below the 10 or 20 EMA. Captures most of the move but gets you out quickly on reversals. Best for day trading and short-term swings.
Moderate: 50 SMA Stop
Exit when price closes below the 50 SMA. Gives the trade room to breathe during normal pullbacks. The standard choice for swing traders.
Conservative: 200 SMA Stop
Exit only when the major trend breaks. Allows large drawdowns in exchange for catching multi-month trends. Best for position traders.
Pro Tip: ATR Buffer
Instead of exiting right at the MA, add an ATR-based buffer. For example: trail at the 20 EMA minus 1× ATR. This prevents being stopped out by normal volatility while still using the MA as your trend guide.
Multi-Timeframe MA Analysis
Using moving averages across multiple timeframes gives you a complete picture of the trend at every scale — from the long-term direction to the short-term entry timing.
The 3-Timeframe System
Determines the overall trend. Only take trades in this direction. Price above weekly 50 SMA = only longs. Below = only shorts.
Identifies your setup. Wait for pullbacks to the 20 EMA on the daily chart. This is where your trade idea forms.
Fine-tunes your entry. When the daily is at the 20 EMA, zoom into the 4H and wait for a bullish 9 EMA crossover for a precise entry with a tight stop.
Timeframe Combinations
| Trading Style | Direction | Setup | Entry |
|---|---|---|---|
| Scalping | 1H 50 SMA | 15M 20 EMA | 5M 9 EMA |
| Day trading | Daily 50 SMA | 1H 20 EMA | 15M 9 EMA |
| Swing trading | Weekly 50 SMA | Daily 20 EMA | 4H 9 EMA |
| Position trading | Monthly 50 SMA | Weekly 20 EMA | Daily 9 EMA |
Common Mistakes to Avoid
Using MAs in Sideways Markets
Moving averages work best in trending markets. In choppy, sideways conditions, you'll get whipsawed with constant false crossover signals. Switch to range strategies or wait for a trend to develop.
Too Many Moving Averages
Chart cluttered with 10 MAs creates analysis paralysis. Pick 2-3 that work for your timeframe and stick with them. More isn't better.
Expecting Precision
Price won't bounce off the MA to the penny. Treat MAs as "zones" rather than exact levels. Give your trades room to breathe.
Ignoring the Bigger Picture
A bullish crossover on the 5-minute chart means nothing if the daily chart is in a clear downtrend. Always check higher timeframes first.
Key Takeaways
- SMA vs EMA: SMA for smooth, long-term analysis; EMA for faster, short-term signals
- Key levels: 20 (short), 50 (medium), 200 (long-term trend)
- Golden/Death Cross: 50 MA crossing 200 MA signals major trend changes
- Best in trends: Avoid using MA crossovers in choppy, sideways markets
- Combine with other tools: MAs work best with volume, RSI, or price action confirmation
Related Guides
Practice Moving Average Strategies
Test MA crossovers and trend strategies risk-free with Nydar's paper trading and $100K virtual capital.
Get Started FreeFurther Reading
- Investopedia: Moving Average explained — SMA, EMA, and crossover strategies
- Investor.gov: Introduction to investing — Official US investor education resource
Written by Ryan Clinton
Founder of Nydar. Software engineer with experience at Cowen Inc (Wall Street) and on large-scale infrastructure projects. Built Nydar to make professional trading tools accessible to everyone.
Last reviewed: March 2026