Fear & Greed Index
Nydar's fear and greed index measures market sentiment across volatility, momentum, and volume signals
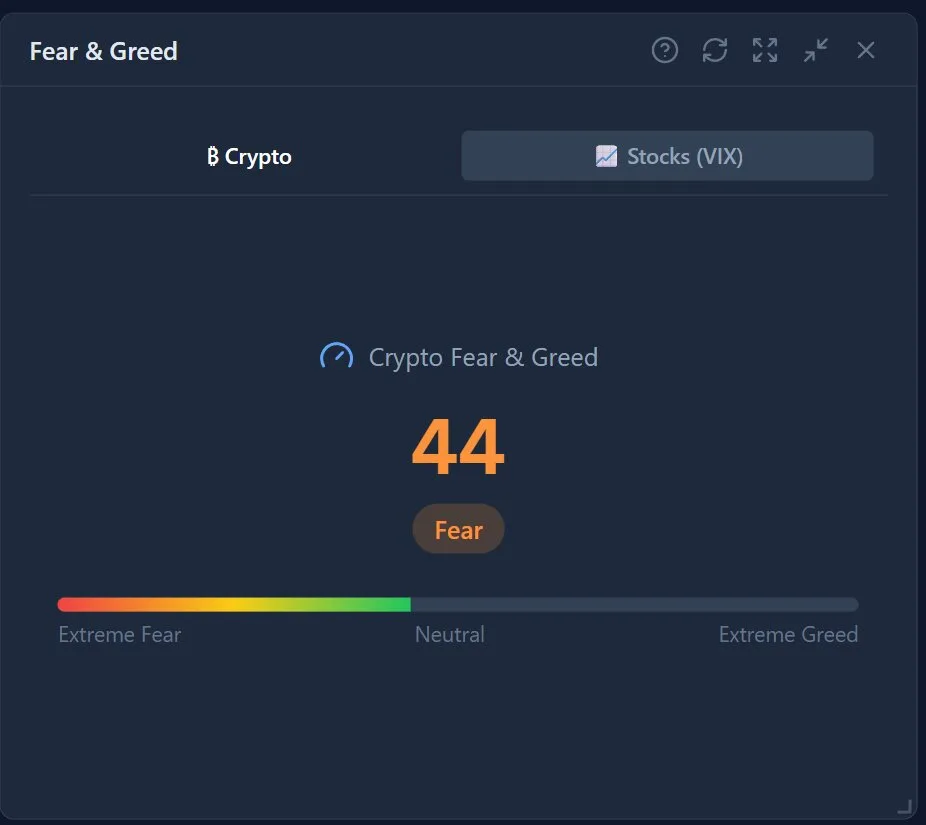
Overview
Nydar's Fear & Greed Index measures overall crypto market sentiment on a 0-100 scale by aggregating 6 weighted data sources updated throughout the trading day. It's a contrarian indicator — extreme readings often precede market reversals.
Nydar combines volatility (25%), market momentum/volume (25%), social media sentiment (15%), surveys (15%), Bitcoin dominance (10%), and Google Trends (10%) into a single score so you can gauge crowd psychology at a glance.
The academic foundation for sentiment-based investing was established by Baker and Wurgler (2006, "Investor Sentiment and the Cross-Section of Stock Returns," The Journal of Finance, 61(4), 1645-1680), who showed that high sentiment predicts low subsequent returns for speculative stocks. Tetlock (2007, "Giving Content to Investor Sentiment: The Role of Media in the Stock Market," The Journal of Finance, 62(3), 1139-1168) further demonstrated that media pessimism predicts downward pressure on market prices, reinforcing the contrarian value of sentiment extremes.
Understanding Nydar's Sentiment Scale
0-24: Extreme Fear
Nydar shows the market is very pessimistic. Investors are worried. Historically, Nydar's Extreme Fear readings have coincided with good buying opportunities as prices are often depressed. "Be greedy when others are fearful."
25-44: Fear
Nydar shows below-average sentiment. Market is cautious but not panicking. Can be accumulation opportunity but less extreme than Nydar's Extreme Fear zone.
45-55: Neutral
Nydar's neutral zone indicates balanced sentiment. Market is neither particularly fearful nor greedy. No strong directional bias from Nydar's sentiment perspective.
56-74: Greed
Nydar shows above-average optimism. Market is confident. Start being cautious with new longs. Consider taking some profits.
75-100: Extreme Greed
Nydar's Extreme Greed zone signals market euphoria. Everyone is bullish. Historically, this has preceded corrections. "Be fearful when others are greedy." Consider reducing exposure.
Data Sources
Nydar's index combines multiple factors with different weights:
Volatility (25%): Current volatility vs 30/90-day averages. High volatility = more fear.
Market Momentum/Volume (25%): Buying volume vs selling volume. High buying = more greed.
Social Media (15%): Twitter/Reddit sentiment analysis. Positive posts = more greed.
Surveys (15%): Weekly polls of crypto investors.
Bitcoin Dominance (10%): High dominance = fear (flight to safety). Low = greed (alt season).
Google Trends (10%): Search volume for crypto terms. High searches can indicate greed or fear depending on context.
How to Use Nydar's Fear & Greed Index
Contrarian Strategy
The most common use of Nydar's index is contrarian trading: buy when Nydar shows extreme fear, sell when Nydar shows extreme greed. This follows Warren Buffett's advice to be "fearful when others are greedy, and greedy when others are fearful."
Trend Confirmation
Use alongside Nydar's technical analysis widgets. A buy signal during extreme fear is stronger than during neutral sentiment. A sell signal during extreme greed is stronger.
Risk Management
Reduce position sizes when Nydar shows extreme greed (market more likely to correct). Be more aggressive when Nydar shows extreme fear (better risk/reward if you believe in long-term value).
Important Warnings About Nydar's Sentiment Data
- Not a timing indicator: Nydar's extreme readings can persist for weeks or months. Don't expect immediate reversals.
- Crypto-specific: Nydar's index measures crypto sentiment, not traditional markets. Don't use Nydar's Fear & Greed reading for stock trading decisions.
- One input among many: Never trade solely on Nydar's sentiment reading. Use with Nydar's price action, technical analysis, and fundamental research tools.
- Extreme can get more extreme: Fear at 20 can drop to 10. Greed at 80 can rise to 95. Don't assume a reading is "as extreme as it gets."
Sentiment Cycle Patterns
Market sentiment follows predictable cycles. Understanding where you are in the cycle helps calibrate your risk:
Phase 1: Disbelief (Fear 10-25)
After a major crash. Everyone thinks the market will keep falling. Few are buying. This is historically the best time to accumulate — prices are depressed and sellers are exhausted.
Phase 2: Hope (Fear 25-45)
Early recovery. Smart money has entered. Retail traders are still sceptical. Good time for position building, but size conservatively as false rallies can occur.
Phase 3: Optimism (Neutral 45-60)
Recovery confirmed. More participants joining. Media coverage increasing. Trend trading works well here — ride the momentum but keep stops.
Phase 4: Euphoria (Greed 75-100)
Everyone is bullish. "This time is different." Social media is flooded with gains. This is the most dangerous phase — prices are stretched and a correction is likely. Start taking profits and tightening stops.
Using Fear & Greed for DCA
A popular strategy is adjusting your dollar-cost averaging (DCA) based on sentiment:
| Sentiment | Index Range | DCA Adjustment | Rationale |
|---|---|---|---|
| Extreme Fear | 0-24 | 2x normal amount | Prices likely depressed; buy more |
| Fear | 25-44 | 1.5x normal amount | Below average — slightly overweight |
| Neutral | 45-55 | Normal amount | Standard DCA — no adjustment |
| Greed | 56-74 | 0.5x normal amount | Prices may be stretched — buy less |
| Extreme Greed | 75-100 | Skip or take profit | Correction likely — preserve capital |
This approach systematically buys more when prices are likely cheap and less when they're expensive — the opposite of what most people naturally do.
Sentiment Divergences
The most actionable signals come from divergences between sentiment and price:
Bullish Divergence
Price makes a new low, but the Fear & Greed index makes a higher low (less fearful than last time).
Meaning: Sellers are exhausted. The fear is diminishing even though prices haven't recovered. Often precedes a rally.
Bearish Divergence
Price makes a new high, but the greed index makes a lower high (less greedy than last time).
Meaning: Enthusiasm is waning despite higher prices. Buyers are losing conviction. Often precedes a correction.
Nydar Pro Tips
- Track historical extremes: In past cycles, Nydar recorded bottoms at Fear <10 and tops at Greed >90. Compare Nydar's current reading to these historical extremes.
- Watch for divergence: If price makes new highs but Nydar's greed reading is lower than the previous high, it may signal weakening momentum.
- Combine with on-chain data: Sentiment extreme + on-chain accumulation/distribution provides stronger signals.
- Check the trend: A move from 30 to 50 (fear decreasing) is different from 70 to 50 (greed decreasing). Direction matters.
How Fear & Greed Compares to Other Nydar Widgets
| Feature | Fear & Greed | Reddit Sentiment | News | Heatmap | Market Breadth |
|---|---|---|---|---|---|
| Primary purpose | Overall sentiment score | Social media mood | Breaking headlines | Visual market overview | Advance/decline ratios |
| Data sources | 6 weighted inputs | Reddit posts/comments | News APIs | Exchange price feeds | Index component data |
| Output format | 0-100 gauge | Bullish/bearish ratio | Headlines + sentiment | Colour-coded grid | A/D line, ratios |
| Best for | Contrarian timing | Retail crowd mood | Event-driven context | Sector performance | Market health check |
| Scope | Crypto market-wide | Per-coin + overall | Multi-asset | 100+ assets, 5 indices | Index components |
| Update frequency | Throughout trading day | Every few minutes | Real-time | Real-time (WebSocket) | Real-time (WebSocket) |
| Ideal pairing | Heatmap, Signals | Fear & Greed, News | Fear & Greed, Chart | Fear & Greed, Breadth | Heatmap, Fear & Greed |
Related Nydar Widgets
Further Reading
Last reviewed: March 2026