IPO Calendar
Nydar's IPO calendar tracks upcoming offerings with pricing ranges, expected dates, and underwriter details
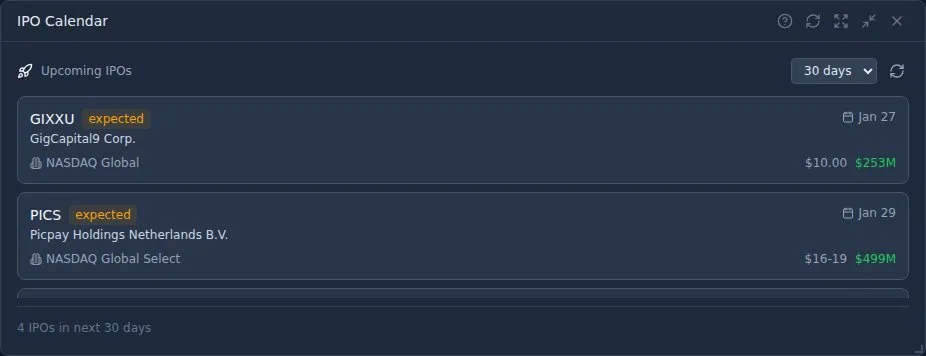
What Is Nydar's IPO Calendar Widget?
An Initial Public Offering (IPO) is when a private company first offers shares to the public. Nydar's IPO Calendar tracks every stage of the process — from initial SEC filing through pricing to first-day trading — with status badges, price ranges, deal sizes, and exchange details for upcoming US listings.
The systematic study of IPO pricing began with Jay R. Ritter's "The Long-Run Performance of Initial Public Offerings" (The Journal of Finance, vol. 46, no. 1, 1991, pp. 3-27), which documented that IPOs are underpriced by an average of 16% on the first day but underperform comparable firms by 29% over 3 years. Loughran & Ritter updated these findings in "Why Has IPO Underpricing Changed Over Time?" (Financial Management, vol. 33, no. 3, 2004, pp. 5-37), showing that first-day returns averaged 65% during the dot-com bubble but normalised to 12% post-2001.
The expected offering price, often shown as a range (e.g., $20-$25)
Total value of shares being offered to the public
Nydar's IPO Status Stages
IPO Trading Risks
- IPOs can be extremely volatile on their first trading days — Nydar flags 4 status stages (Filed, Expected, Priced, Withdrawn) so you know exactly where each offering stands
- Lock-up periods may cause selling pressure months later — Nydar's IPO data includes expected lock-up expiry dates
- Limited historical data makes analysis difficult — cross-reference with Nydar's Stock Info widget once the ticker is live
- Retail investors often can't get shares at the IPO price
- Many IPOs underperform the market in their first year — use Nydar's Chart widget to track post-IPO price action
Nydar's Tips for IPO Research
- Read the S-1 filing to understand the business model
- Check the use of proceeds - is it for growth or paying off debt?
- Use Nydar's Stock Info widget to review revenue trends and path to profitability once the ticker is listed
- Consider waiting for the lock-up period to expire — Nydar tracks lock-up dates
Nydar's IPO Trading Strategies
First-Day Trading
IPOs often see extreme volatility on day one. Some traders buy the initial dip after the opening pop, while others wait for a clear trend to form. Use Nydar's Chart widget to monitor the first 30 minutes — typically the most volatile as supply and demand find equilibrium.
Lock-Up Expiry Strategy
Insiders are usually locked from selling for 90-180 days after IPO. Nydar's IPO data tracks these lock-up dates. When the lock-up expires, a flood of insider selling often causes temporary price drops. Some traders short before lock-up expiry or buy the dip after selling subsides.
Quiet Period End
Analysts can't publish research during the quiet period (usually 25-40 days post-IPO). When it ends, analyst coverage begins and can drive significant price movement. Cross-reference with Nydar's Analyst Ratings widget once coverage initiates, especially if multiple analysts start with "Buy" ratings.
Nydar's IPO Evaluation Checklist
Is revenue growing consistently? Look for 20%+ YoY growth. Nydar's Stock Info widget shows financials once the ticker is listed.
Are margins improving? When does management expect profitability?
Growth investment is bullish. Paying off debt or cashing out founders is a red flag.
Does the company have a moat? How defensible is their market position? Use Nydar's News widget to track sector competitors.
Founders retaining large stakes shows confidence. Heavy selling at IPO is concerning. Nydar's Institutional Holdings widget tracks insider transactions post-listing.
How IPO Calendar Compares to Other Nydar Widgets
| Feature | IPO Calendar | IPO Lockup Tracker | Earnings Calendar | News Feed | Stock Info |
|---|---|---|---|---|---|
| Primary Focus | Upcoming new listings | Lockup expiry dates | Quarterly earnings dates | Breaking market news | Company fundamentals |
| Event Type | One-time listing | One-time unlock | Recurring quarterly | Continuous stream | On-demand lookup |
| Look-Ahead Window | 1-3 months forward | 90-180 days post-IPO | 1-4 weeks forward | Real-time | Current snapshot |
| Key Data Points | Price range, deal size | Shares unlocked, % float | EPS estimate, surprise | Headlines, sentiment | P/E, margins, insiders |
| Best For | New opportunity discovery | Supply pressure timing | Catalyst timing | Breaking catalysts | Due diligence |
| Pairs Well With | Stock Info | IPO Calendar | Analyst Ratings | All widgets | IPO Calendar |
Learn More on Nydar
Deepen your understanding with Nydar's learning guides:
Related Topics
Further Reading
Last reviewed: March 2026