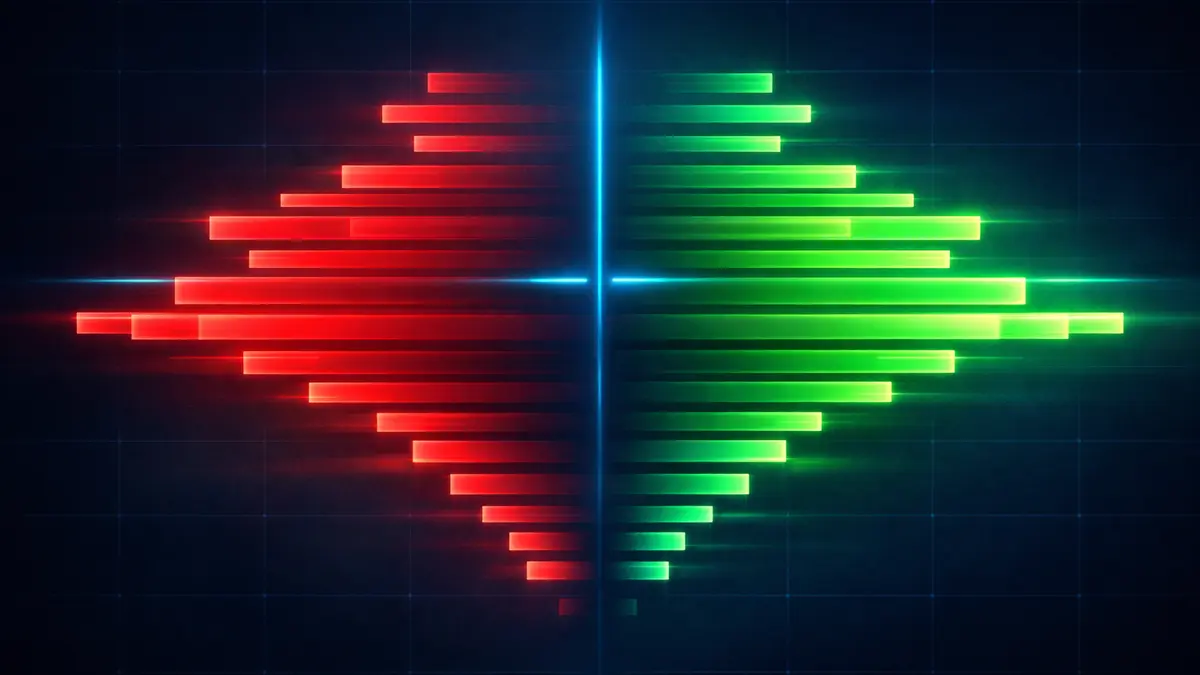
Level 2 Market Depth
Nydar's Level 2 market depth displays up to 5,000 price levels of bid and ask data with sub-second WebSocket streaming, automatic wall detection for orders 5-10x larger than surrounding depth, spoofing alerts, and real-time bid/ask imbalance calculation across 200+ crypto pairs, US stocks, and 50+ forex pairs.
Built on the limit order book mechanics described by Larry Harris in Trading and Exchanges (Oxford, 2003) and the market microstructure framework from Maureen O'Hara's Market Microstructure Theory (Blackwell, 1995). Nydar's Market Replay captures up to 150 order book snapshots per session at 15 depth levels — the same post-trade analysis technique used by professional prop desks.
Trading Edge with Level 2
Spot Support & Resistance
Nydar flags order walls 5-10x larger than surrounding depth. A 50 BTC bid wall at $42,000 acts as support until absorbed — visible in the order book before price reaches it.
Gauge Buying Pressure
Nydar calculates order flow imbalance in real time. A 70% bid imbalance means buyers outnumber sellers 2.3-to-1 at current prices — a quantifiable edge over chart-only analysis.
Detect Spoofing Activity
Nydar monitors for orders that appear and disappear repeatedly — a manipulation pattern where a large bid appears 50+ times in 10 minutes without filling, as described by O'Hara in Market Microstructure Theory (1995).
Level 1 vs Level 2 Data on Nydar
Most platforms only show Level 1 (top-of-book) data. Nydar provides full Level 2 depth with up to 5,000 price levels, wall detection, and imbalance analysis — the same data professional market makers use for execution decisions.
| Feature | Level 1 | Level 2 |
|---|---|---|
| Best bid/ask | Single best price | Full depth of all prices |
| Order sizes | Top of book only | Every price level's volume |
| Large orders | Not visible | Walls and clusters visible |
| Liquidity gaps | Not visible | Gaps show where price may jump |
| Order flow | Basic volume | Bid/ask imbalance & pressure |
| Use case | Casual monitoring | Active trading & scalping |
Level 1 shows you where the market is. Level 2 shows you where it's likely to go.
Reading Nydar's Depth Chart
Nydar's depth chart visualizes all bids and asks as cumulative curves across up to 5,000 price levels. The chart reveals 4 key signals: bid/ask walls, liquidity gaps, spread width, and imbalance direction.
Bid Side (Green/Left)
The left side of the depth chart shows cumulative buy orders. A steep wall means strong buying interest at that price.
- Steep wall: Significant buy support — price unlikely to drop past it easily
- Gradual slope: Thin buy interest — price could fall quickly through this zone
- Flat spots: No orders at those prices — potential gap zones
Ask Side (Red/Right)
The right side shows cumulative sell orders. Large sell walls act as resistance that price must absorb before moving higher.
- Large sell wall: Heavy resistance — price needs strong buying to break through
- Thin ask side: Low resistance — breakouts can be fast and sharp
- Sudden wall removal: Someone pulled their orders — may signal incoming move
The Spread
The gap between the best bid and best ask is the spread. It tells you about liquidity and trading costs.
- Tight spread (0.01-0.05%): High liquidity, low slippage — ideal for active trading
- Wide spread (>0.1%): Low liquidity — market orders will lose more to slippage
- Widening spread: Uncertainty increasing — market makers pulling back
Imbalance Signals
When one side of the book is significantly larger than the other, it creates an imbalance that often predicts short-term direction.
- 60%+ bid imbalance: More buyers than sellers — bullish pressure
- 60%+ ask imbalance: More sellers than buyers — bearish pressure
- 50/50 balance: Equilibrium — wait for a shift before acting
Identifying Institutional Activity with Nydar
Institutional traders leave footprints in the order book that Nydar detects automatically. Research by Harris (Trading and Exchanges, Oxford, 2003) shows that large orders account for the majority of price discovery — Nydar makes these footprints visible through 3 detection methods.
Order Walls
Large orders sitting on the book at specific price levels. A 50 BTC buy wall at $42,000 means someone is willing to buy up to 50 BTC there.
How to spot:
- - Size 5-10x larger than surrounding orders
- - Often at round numbers ($40K, $50K)
- - Highlighted automatically in Nydar's order book
Spoofing & Fake Walls
Not all walls are genuine. Some traders place large orders to manipulate the market, then cancel before they're filled.
Warning signs:
- - Wall appears and disappears repeatedly
- - Order moves away as price approaches
- - Size fluctuates rapidly (500 → 100 → 500)
Iceberg Orders
Large traders often hide their true size. An iceberg order shows only a small visible portion while the rest executes in hidden chunks.
How to detect:
- - Same price level keeps refilling after trades
- - Time & sales shows repeated fills at one price
- - Volume absorbed far exceeds visible order size
Reading Nydar's Time & Sales Tape
Nydar's time & sales tape streams every executed trade in real time with sub-second latency. The tape reveals what is actually happening — aggressive buying, selling, or absorption — versus what is just sitting passively on the order book.
What the Colours Mean
Green trades (buy)
Executed at or above the ask price — aggressive buyer lifted the offer
Red trades (sell)
Executed at or below the bid price — aggressive seller hit the bid
Grey/neutral trades
Executed between bid and ask — midpoint or negotiated trade
Tape Reading Patterns
Rapid green prints at increasing sizes
Buyers are aggressively accumulating. Often precedes a breakout when combined with thinning asks.
Large red prints absorbing a bid wall
A support level is being tested. If the wall gets eaten, the next bid level becomes the new support.
Alternating small prints with no direction
Low conviction trading — the market is consolidating. Wait for one side to dominate before acting.
Frequently Asked Questions
What assets support Level 2 data on Nydar?
Nydar provides Level 2 order book data for all 200+ cryptocurrency pairs with up to 5,000 price levels of depth. Stock and forex Level 2 depth is also available, with coverage varying by data provider and exchange connectivity. The depth chart and imbalance features work across all supported assets.
How fast does Nydar's order book update?
Nydar streams order book data via WebSocket with sub-second updates. Only changed price levels are transmitted using efficient differential updates, so traders see changes as they happen on the exchange with minimal bandwidth usage.
What is order flow imbalance?
Order flow imbalance measures the ratio of buy orders to sell orders in the order book. Nydar calculates this in real time — when 70% of volume sits on the bid side, buyers outnumber sellers 2.3-to-1, which often precedes upward price movement. This is a core concept in market microstructure theory as described by Maureen O'Hara (Market Microstructure Theory, 1995).
How does Nydar detect spoofing in the order book?
Nydar monitors for orders that appear and disappear repeatedly at the same price level — a pattern associated with market manipulation. When a large bid appears 50+ times in 10 minutes without filling, or an order moves away as price approaches, Nydar flags the activity as a potential spoof.
What is an order wall and how does Nydar detect them?
An order wall is a resting order that is 5-10x larger than surrounding depth at nearby price levels. Nydar automatically detects and highlights these walls in the order book display. Walls often appear at round-number price levels (e.g. $40,000, $50,000) and act as support or resistance until absorbed by aggressive orders.
Can I replay the order book on Nydar?
Yes. Nydar's Market Replay captures up to 150 order book snapshots per session, storing bid/ask depth at 15 levels alongside the last 10 trades at each snapshot. Traders scrub backward through time to reconstruct how the book evolved before a major price move — a technique used by professional prop traders for post-trade analysis.
What is the difference between Level 1 and Level 2 data?
Level 1 shows only the best bid and ask price (top of book). Level 2 on Nydar displays the full depth of market — up to 5,000 price levels showing every resting order, their sizes, and cumulative volume. This reveals liquidity gaps, order walls, and imbalance patterns invisible in Level 1 data.
How do I use Level 2 with other Nydar tools?
Nydar's Level 2 order book works best combined with chart analysis and order flow widgets. Use support and resistance levels to identify key prices, then check order book depth at those levels for genuine buying or selling interest. Combine with Nydar's footprint charts for volume delta and the liquidation heatmap to see where leveraged positions cluster. See the Level 2 widget guide for setup instructions, or read the guide to reading Level 2 data.
Nydar Level 2 Features
Nydar provides 6 Level 2 market depth tools: full order book depth (5,000 levels), order flow imbalance, wall detection, time & sales tape, depth chart visualization, and market replay with 150 snapshots per session.
Full Order Book Depth
Nydar displays up to 5,000 price levels of bid and ask data per symbol, revealing the complete liquidity landscape beyond the top-of-book quote
- Up to 5,000 price levels per symbol
- Real-time bid/ask updates via WebSocket
- Cumulative volume display at each level
- Spread monitoring with tight/wide alerts
Order Flow Imbalance
Nydar calculates bid/ask imbalance as a percentage ratio, showing whether buyers or sellers dominate the current order book
- Bid/ask volume ratio updated in real time
- Imbalance percentage (e.g. 70% bid = bullish)
- Historical imbalance comparison over time
- Trend direction signals from imbalance shifts
Large Order Detection
Nydar automatically flags orders 5-10x larger than surrounding depth as institutional walls that act as support or resistance
- Automatic wall detection using statistical thresholds
- Size threshold alerts for orders above user-defined levels
- Support/resistance mapping from wall positions
- Institutional order tracking across price levels
Time & Sales Tape
Nydar streams every executed trade in real time with colour-coded buy/sell aggressor tagging based on bid/ask execution price
- Real-time trade stream with sub-second latency
- Green (buy at ask) / red (sell at bid) colouring
- Large trade highlighting above configurable size
- Trade aggregation by time window
Depth Chart Visualization
Nydar renders cumulative bid/ask curves as an interactive depth chart, making liquidity gaps and order clusters visible at a glance
- Cumulative bid/ask curves with fill shading
- Liquidity gap zones highlighted automatically
- Dynamic scaling that adjusts to order book range
- Interactive zoom and pan across price levels
Market Replay
Nydar captures up to 150 order book snapshots per session with 15 depth levels and last 10 trades, enabling post-trade analysis
- Up to 150 historical snapshots per session
- Bid/ask depth at 15 levels per snapshot
- Last 10 trades recorded at each snapshot
- Scrub backward to reconstruct pre-move book state
Last updated: March 2026
Access Nydar's Full Order Book
Start trading with 5,000 levels of market depth, wall detection, spoofing alerts, and market replay — free with $100k virtual capital.
Get Started Free