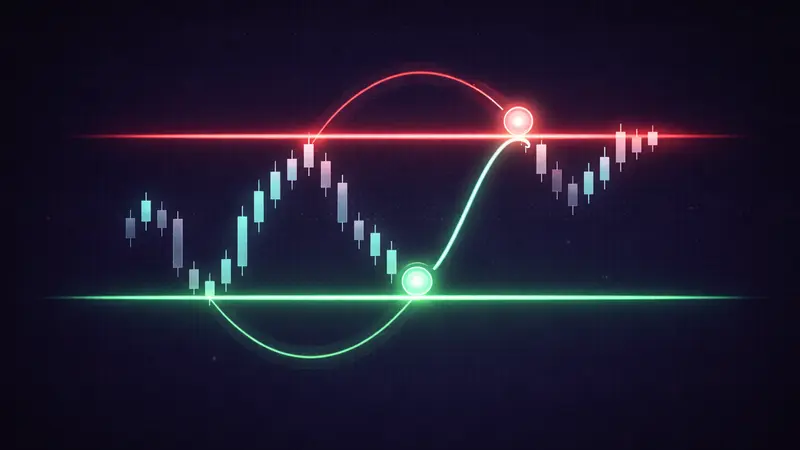
What is Reversal Trading?
Reversal trading aims to identify when an existing trend is ending and a new trend in the opposite direction is beginning. It's a higher-risk, higher-reward approach compared to trend following because you're trading against the current momentum. The Signals widget can help you spot potential reversal setups automatically.
Warning: Advanced Strategy
Reversal trading has a lower success rate than trend following. Many apparent reversals are just pullbacks within the larger trend. This strategy requires strict risk management and acceptance of frequent small losses.
Reversal vs. Pullback
Reversal
- • Complete change of trend direction
- • Creates new opposing trend
- • Often starts at major support/resistance
- • Confirmed by structural breaks
Pullback
- • Temporary move against the trend
- • Trend resumes after the pullback
- • Usually to moving averages or Fib levels
- • No structural break
Signs of Trend Exhaustion
Before a reversal occurs, trends typically show signs of weakening. Learning to spot these signs gives you early warning that a reversal might be coming.
1. Divergence
When price makes new highs/lows but momentum indicators show divergence. Nydar's Signals widget flags RSI and MACD divergence automatically.
2. Volume Climax
Extremely high volume often marks trend exhaustion as the last buyers/sellers enter.
- Massive volume spike at new high/low
- Often accompanied by long wicks (rejection)
- "Blow-off top" or "selling climax" patterns
3. Momentum Loss
The trend moves slower, candles get smaller, ranges contract.
- RSI failing to reach overbought/oversold
- ADX declining from high readings
- Smaller candle bodies, longer wicks
4. Failed Breakouts
When price breaks to new highs/lows but immediately reverses back.
- Price breaks above resistance, then closes below it — a failed breakout
- Creates a "fake out" that traps breakout traders
- Often leads to sharp moves in opposite direction
Key Reversal Patterns
Double Top / Double Bottom
Price tests a level twice and fails, signaling reversal.
Double Top (Bearish)
- • Two peaks at similar price level
- • Neckline = low between the peaks
- • Entry: Break below neckline
- • Target: Height of pattern below neckline
Double Bottom (Bullish)
- • Two troughs at similar price level
- • Neckline = high between the troughs
- • Entry: Break above neckline
- • Target: Height of pattern above neckline
Head and Shoulders
Classic reversal pattern with three peaks, the middle one highest.
Pattern Components:
- • Left Shoulder: First peak, pullback
- • Head: Higher peak than shoulders
- • Right Shoulder: Lower peak than head
- • Neckline: Connect the pullback lows
- • Entry: Break below neckline
- • Target: Distance from head to neckline
Candlestick Reversal Patterns
Bullish Reversals
- • Hammer at support
- • Bullish engulfing
- • Morning star
- • Piercing pattern
Bearish Reversals
- • Shooting star at resistance
- • Bearish engulfing
- • Evening star
- • Dark cloud cover
Entry Strategies
1. Pattern Completion Entry
Wait for the reversal pattern to complete before entering.
- Enter on neckline break (double top, H&S)
- Wait for close beyond the level, not just wick
- Higher confirmation but may miss some of the move
2. Anticipation Entry
Enter before pattern completion at key support/resistance.
- Enter at second touch of support/resistance
- Better price but lower probability
- Requires tighter stops and quick exits if wrong
3. Retest Entry
Wait for price to break, then retest the broken level.
- Pattern breaks neckline, then pulls back to retest
- Retest confirms the break was legitimate
- Tighter stop placement at retest level
Best Practice: Multi-Timeframe
Look for reversal signals on your trading timeframe, but confirm the reversal makes sense on a higher timeframe. A double bottom on the 1-hour at major weekly support is more powerful than one in the middle of nowhere.
Risk Management for Reversals
Reversal trading requires stricter risk management because you're trading against the prevailing trend. Many reversal attempts fail.
Critical Rules
Smaller Position Sizes
Risk 0.5-1% per trade instead of the usual 1-2%. Reversals fail often.
Clear Invalidation Levels
Know exactly where your reversal thesis is wrong. Stop goes beyond the reversal pattern's extreme.
Require Multiple Confirmations
Don't trade on a single signal. Combine patterns + divergence + support/resistance.
Accept Frequent Losses
Expect 50-60% of reversal trades to fail. Success comes from big winners when you catch true reversals.
Stop Loss Placement
For Long Reversals
- • Below the reversal pattern low
- • Below the neckline after breakout
- • Add buffer for volatility (ATR)
For Short Reversals
- • Above the reversal pattern high
- • Above the neckline after breakout
- • Add buffer for volatility (ATR)
Common Reversal Trading Mistakes
Catching Falling Knives
Buying simply because price has dropped a lot. "It's down 50%, it has to bounce!" Price can always go lower. Wait for actual reversal signals.
Fighting Strong Trends
Trying to short a stock making new all-time highs. Trends can extend far beyond what seems reasonable. Wait for actual exhaustion signs.
Ignoring Higher Timeframes
Trading a reversal on the 5-minute chart against the clear daily trend. Lower timeframe reversals often fail when the higher timeframe trend is strong.
Moving Stops
Widening your stop because "it looks like it's about to turn." If price hits your invalidation level, the reversal has failed. Exit.
Combining Reversals with Trend Following
The most effective approach combines reversal and trend-following techniques. Use reversals to catch the turn, then switch to trend-following to ride the move.
Hybrid Approach
Identify Potential Reversal
Spot exhaustion signs and reversal patterns at key levels.
Enter Small Position
Take initial position with tight stop at reversal point.
Wait for Trend Confirmation
Once new trend establishes (MA crossover, higher highs/lows), add to position.
Trail Stop with Trend
Use trend-following exit methods (trailing stop, MA) to ride the new trend.
Key Takeaways
- 1
Wait for exhaustion signs, don't predict
Divergence, volume climax, and pattern completion confirm reversals.
- 2
Use smaller position sizes
Reversal trading has lower win rate—protect capital with reduced sizing.
- 3
Require multiple confirmations
Pattern + divergence + support/resistance = higher probability reversal.
- 4
Clear stop placement is critical
Know exactly where your thesis is invalidated before entering.
- 5
Respect higher timeframes
Reversals at major higher-timeframe levels have much better odds.
Practice Reversal Trading Risk-Free
Use the Pattern Recognition widget to spot reversal candlesticks, and the Indicators widget to confirm with RSI divergences.
Get Started FreeFurther Reading
- Investopedia: Reversals in trading — Spotting trend exhaustion and turning points
- Investor.gov: Introduction to investing — Official US investor education resource
Written by Ryan Clinton
Founder of Nydar. Software engineer with experience at Cowen Inc (Wall Street) and on large-scale infrastructure projects. Built Nydar to make professional trading tools accessible to everyone.
Last reviewed: March 2026